Imagine you're managing a network, and, for example, an interface goes down on your router. How do you find out what happened?
This is where SYSLOG protocol can help you! It's a standardized protocol used by network devices like routers and switches to send status updates and alerts.
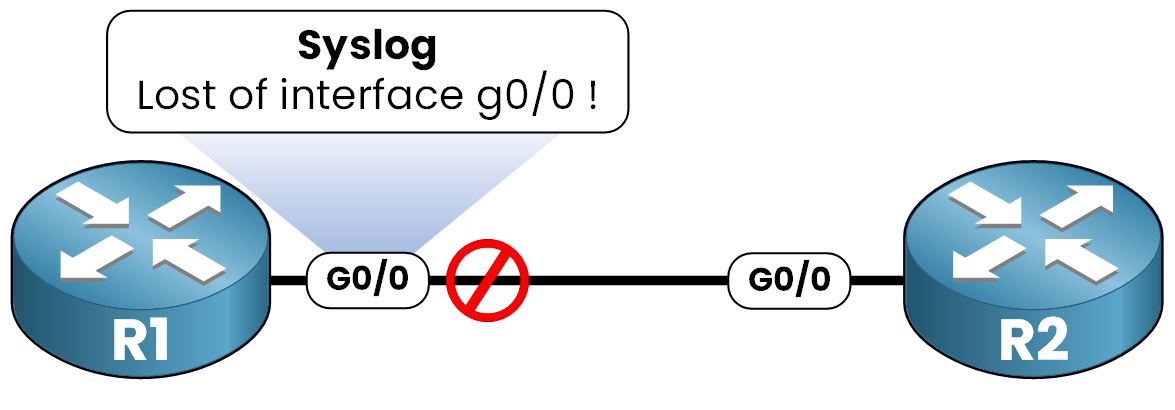
Figure 1 – Syslog message triggered when interface g0/0 goes down
If an interface goes down on our Router R1, SYSLOG will immediately generate a message like this:
R1#
%LINEPROTO-5-UPDOWN: Line protocol on Interface GigabitEthernet0/0, changed state to down
This message tells you that the interface is no longer operational!
Answer the question below
What protocol is used by network devices to send status updates and alerts?
When a Cisco device detects an event, such as an interface going down, it generates a SYSLOG message. This message can be sent to different destinations, depending on how your device is configured.
Let's look at each logging method and how it behaves in practice.
Console Logging
When you're physically connected to the router through the console port, SYSLOG messages are displayed in real time on your terminal.
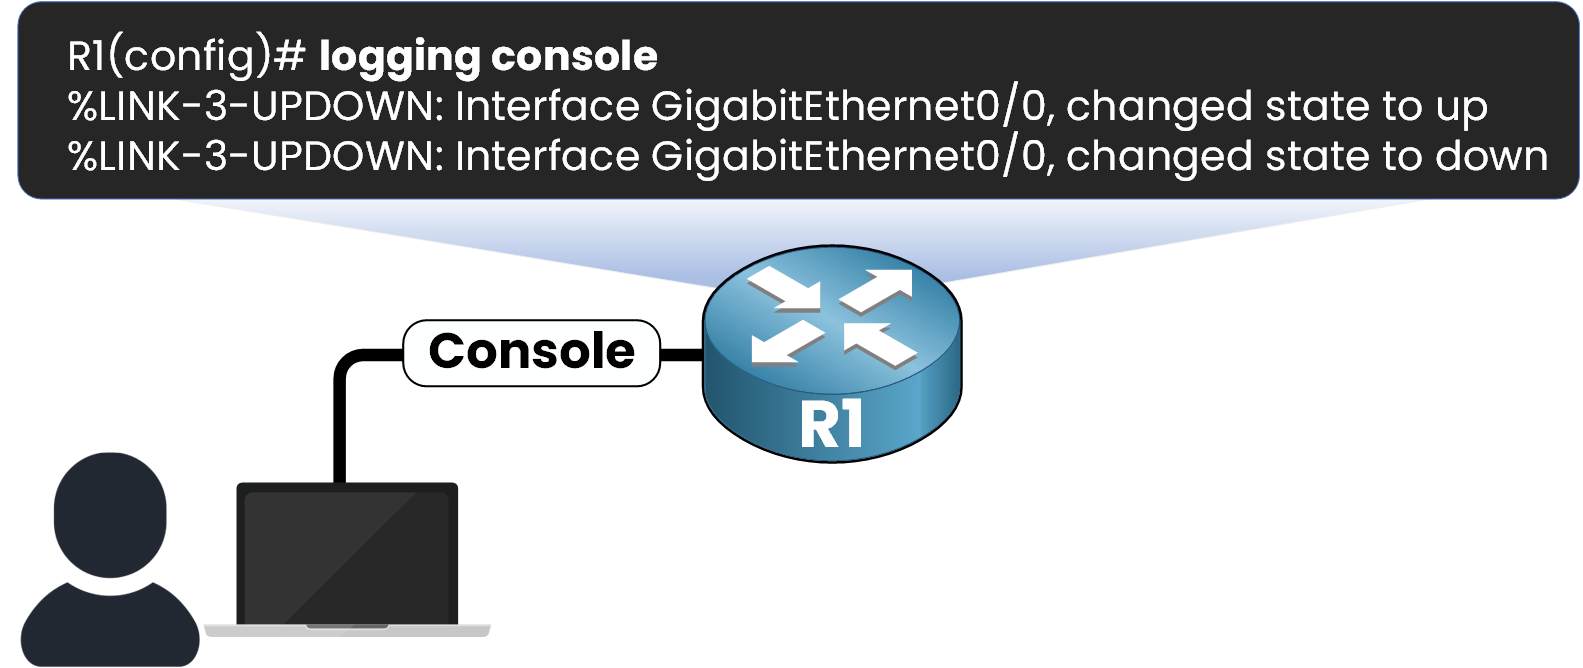
Figure 2 – Syslog messages displayed live through the console connection
This type of logging is enabled by default and is ideal for local troubleshooting during initial configuration. The logging console command can be used if your device has console logging disabled!
But let me tell you, if the session is closed or the device reboots, all logs are lost...
Terminal Logging (Telnet/SSH)
When connecting remotely via SSH or Telnet, SYSLOG messages are not displayed by default. To see them, you need to explicitly enable real-time logging on your session by using the terminal monitor command.
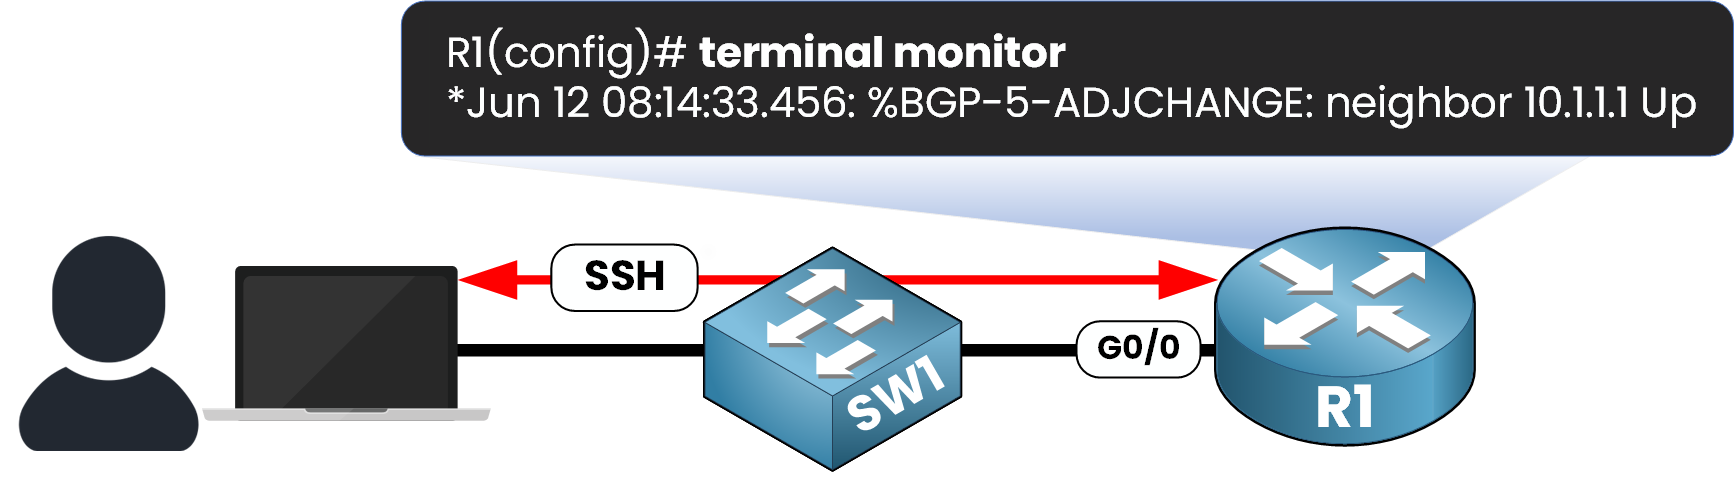
Figure 3 – Real-time logging over SSH or Telnet using the terminal monitor command
This command affects only your current session and must be re-entered if you reconnect to the device.
Buffered Logging (RAM)
Buffered logging allows you to store log messages temporarily in RAM.
This means you can view them even after an event has occurred, as long as the device hasn't rebooted.You can choose how much memory to allocate for logging.
Let me show you how to configure buffered logging:
R1(config)# logging buffered ?
  <0-7>              Logging severity level
  <4096-2147483647>  Logging buffer size (default is 4096)
  alerts             (level 1)
  critical           (level 2)
  debugging          (level 7)
  emergencies        (level 0)
  errors             (level 3)
  informational      (level 6)
  notifications      (level 5)
  warnings           (level 4)
R1(config)# logging buffered 16384 4This command sets 16,384 bytes of buffer space and stores only logs with severity 4 (warnings) and higher. (we will see severity levels in section 4)
To review the logs, use the command show logging:
R1# show logging
Syslog logging: enabled (0 messages dropped, 0 flushes, 0 overruns)
    Console logging: level debugging, 7 messages logged, xml disabled,
                     filtering disabled
    Monitor logging: level debugging, 0 messages logged, xml disabled,
                     filtering disabled
    Buffer logging:  level warnings, 36 messages logged, xml disabled,
                     filtering disabled
    Exception Logging: size (4096 bytes)
    Count and timestamp logging messages: disabled
    Persistent logging: disabled
    Trap logging: level informational, 39 message lines logged
        Logging to 192.168.10.1 via udp on port 514
        Logging Source-Interface:       not set
        VRF Name:                       (default)

Log Buffer (16384 bytes):
*Jun 12 08:14:21.012: %SYS-5-CONFIG_I: Configured from console by admin on vty0 (192.168.1.100)
*Jun 12 08:14:22.123: %LINEPROTO-5-UPDOWN: Line protocol on Interface GigabitEthernet0/1, changed state to up
*Jun 12 08:14:23.315: %LINK-3-UPDOWN: Interface GigabitEthernet0/2, changed state to down
*Jun 12 08:14:24.417: %LINEPROTO-5-UPDOWN: Line protocol on Interface GigabitEthernet0/2, changed state to down
*Jun 12 08:14:27.789: %SEC-6-IPACCESSLOGP: list 101 permitted tcp 10.1.1.5(51304) -> 172.16.1.10(22), 1 packet
*Jun 12 08:14:31.456: %SYS-5-CONFIG_I: Configured from memory by console
*Jun 12 08:14:33.111: %BGP-5-ADJCHANGE: neighbor 10.1.1.1 Up
*Jun 12 08:14:35.962: %SYS-4-WARNING: High CPU utilization detected on process 'routing'
Syslog Server (Centralized Storage)
In enterprise environments, logs are sent to a central Syslog server for long-term storage. This allows you to keep a complete history of events from multiple devices in one place.
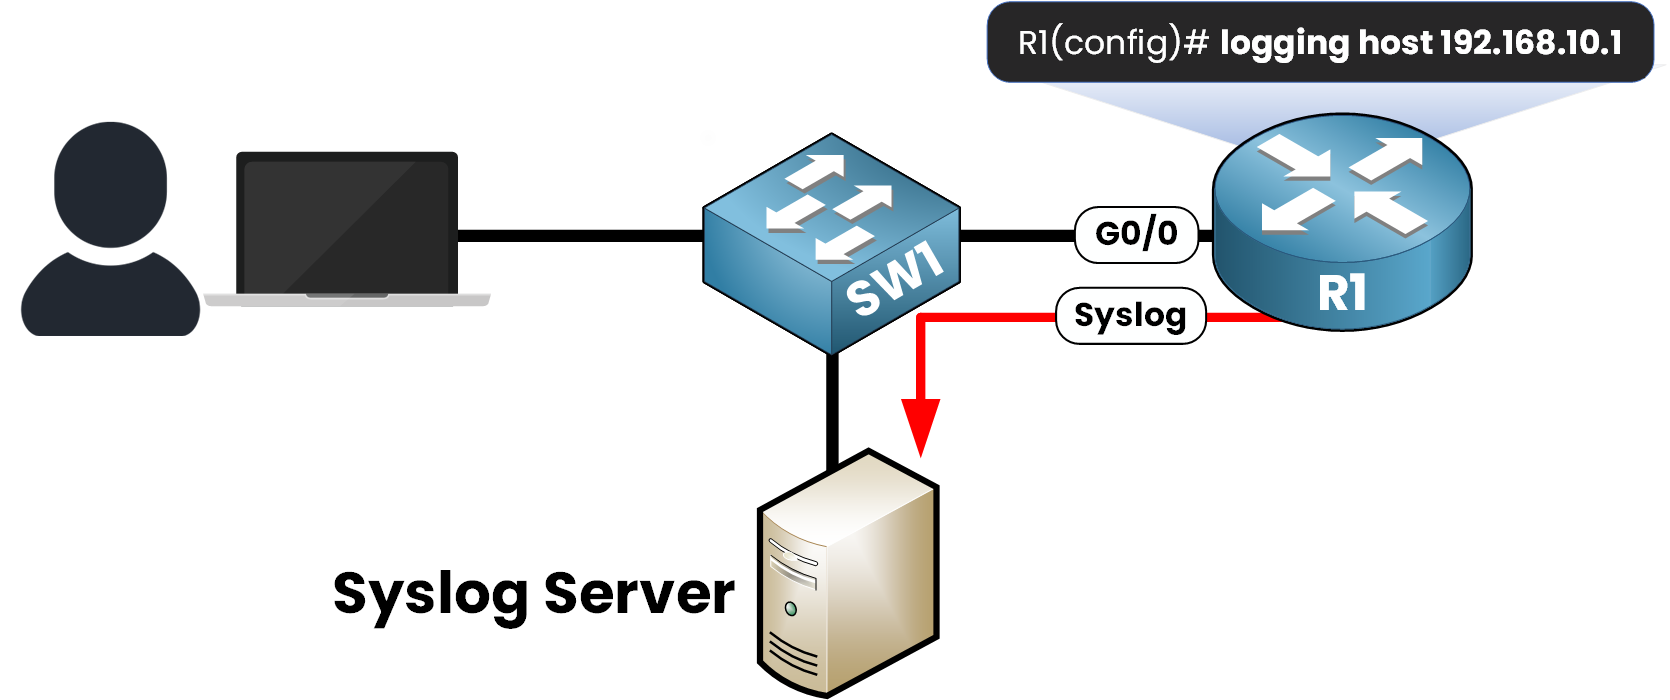
Figure 4 – Syslog messages sent to a centralized server for long-term storage
In the diagram, R1 is configured to send logs to a server over the network. This ensures that even if R1 reboots, the logs are still archived and available for analysis.
Syslog uses UDP port 514 to send messages.
Where Can Syslog Messages Be Sent?
If we summarize, here you can see a table of all SYSLOG destinations, the relevant configuration commands and how they behave:
Destination
Command(s)
Persistent Storage?
Use Case
Console
logging console
No
Live logs on physical console, default enabled
Terminal (SSH/Telnet)
logging monitor + terminal monitor
No
Live logs during remote session, must be manually enabled
Buffer (RAM)
logging buffered [size] + show logging
No
View past logs after events occurred (until reboot)
Syslog Server
logging host [IP] + logging trap [level]
Yes
Long-term storage
Table 1 - Syslog Message Destination
Answer the question below
According to the table, which Syslog destination stores messages in RAM?
Syslog messages need a structure in order to be understood by network administrators.
Each SYSLOG message provides structured information to help you diagnose network events. Here's what a SYSLOG message typically contains:
Timestamp: When the event happened.
Facility Code: The part of the system that generated the message.
Severity Level: How critical the event is.
Mnemonic: A short identifier for the event type.
Message Text: A detailed description of what happened.
Let's view an example
When an interface goes down, a SYSLOG message might look like this:
R1#
%LINEPROTO-5-UPDOWN: Line protocol on Interface GigabitEthernet0/0, changed state to down
Facility Code: %LINEPROTO (related to the interface protocol)
Severity Level: 5 (Notification level)
Mnemonic: UPDOWN (Interface status change)
Message Text: The interface went down.
Answer the question below
What does the Syslog message contain to show when an event happened?
Not all Syslog messages have the same level of importance.
To help network engineers prioritize, each message is assigned a severity level ranging from 0 to 7, where 0 is the most critical and 7 is the least.
Level
Name
Meaning
Example Message
0
Emergency
System is unusable
%SYS-0-EMERG: System running beyond physical memory
1
Alert
Immediate action required
%LINK-1-UPDOWN: Interface GigabitEthernet0/1, changed state to administratively down
2
Critical
Critical condition
%LINEPROTO-2-UPDOWN: Line protocol on Interface GigabitEthernet0/0, changed state to down
3
Error
Error condition
%ETHPORT-3-IF_ERROR_VLANS_SUSPENDED: VLANs on Interface Gi0/1 suspended
4
Warning
Warning condition
%SYS-4-CONFIG_NEW: Configured from console by admin
5
Notification
Normal but significant condition
%LINEPROTO-5-UPDOWN: Line protocol on Interface GigabitEthernet0/2, changed state to up
6
Informational
Informational message
%SYS-6-LOGGINGHOST_STARTSTOP: Logging to host 192.168.1.100 started
7
Debugging
Debugging messages (detailed)
%DEBUG-7-IP: ICMP echo request sent to 10.1.1.1 from 192.168.1.1
These severity levels can be difficult to learn, but look at this simple phrase together:
"Every Awesome Cisco Engineer Will Need Ice Cream Daily."
Each word helps you remember the Syslog severity levels from 0 to 7:
Level
Severity
Memory Hook
0
Emergency
Every
1
Alert
Awesome
2
Critical
Cisco
3
Error
Engineer
4
Warning
Will
5
Notification
Need
6
Informational
Ice Cream
7
Debugging
Daily
You just need to repeat the phrase a few times and you'll never forget the order again.
Answer the question below
What severity level corresponds to Emergency?
In large networks, devices can generate hundreds of log messages every minute.
To keep things organized, Syslog Facility Codes are used to identify the source or origin of each Syslog message, such as the system, an interface or a security process.These codes allow administrators to filter logs more efficiently, helping them focus only on the messages that matter, like authentication failures, link changes, or system warnings, instead of being overwhelmed by irrelevant logs.
Overview of Facility Codes
Facility Code
Description
Example Messages
KERNEL
Kernel-related messages
%KERNEL-3-CRIT: Kernel panic - system halted.
AUTH
Authentication and user access
%AUTH-4-LOGIN_FAILURE: Failed login attempt from 192.168.1.100.
SEC
Security-related events (firewall, unauthorized access)
%SEC-5-ACL_PERMIT: Access granted to 10.0.0.5 via ACL 101.
SYS
General system messages
%SYS-6-LOGGING_HOST: Logging server set to 192.168.1.10.
LINK
Interface status changes
%LINK-3-UPDOWN: Interface GigabitEthernet0/1, changed state to down.
LINEPROTO
Line protocol status
%LINEPROTO-5-UPDOWN: Line protocol on Interface GigabitEthernet0/1, changed state to up.
DAEMON
Messages from background system services
%DAEMON-6-NTP_SYNC: NTP synchronized with 192.168.1.1.
Example
When an interface goes down, the message might look like this:
%LINK-3-UPDOWN: Interface GigabitEthernet0/1, changed state to downBreaking it down:
%LINK → The facility code indicates that the message is related to interface link status.
3 → The severity level (Error).
UPDOWN → The message mnemonic, showing that the interface state changed.
Message text → Specifies the affected interface and the new state.
This allows administrators to quickly understand the issue and take appropriate action.
Answer the question below
Which facility code indicates interface link status changes?
What You Should Remember
🔵 What is Syslog
A protocol used by network devices to report important events, like interface changes, errors, or configuration updates.🔵 Syslog Destinations
Messages can be sent to different places:Console: Real-time logs if you're connected physically (enabled by default)
Terminal (SSH/Telnet): Requires terminal monitor to show logs remotely
Buffer (RAM): Stores logs temporarily in memory (logging buffered)
Syslog Server: Centralized storage for long-term analysis (logging host)
🔵 Syslog Message Structure
Every message contains:A timestamp
A facility code (which part of the system generated it)
A severity level (how urgent it is)
A mnemonic and a short message
🔵 Syslog Severity Levels (0–7)
Used to rank the importance of each message, from Emergency (0) to Debugging (7).
Lower numbers mean more critical issues.🔵 Syslog Facility Codes
Let you identify the origin of the log: system messages, link status, security events, etc.If you understand this, you'll troubleshoot better and spot problems faster.
Answer the question below
Click 'Complete' to continue