EIGRP selects routes by comparing numerical values called metrics.
The path with the lowest metric is considered the best path and becomes the successor.EIGRP does not rely on a single parameter. It uses a composite metric calculated from a mathematical formula.
You are not expected to memorize the formula for the CCNP exam.
However, you must understand:Which parameters are involved
How they influence the metric
How they behave across the network
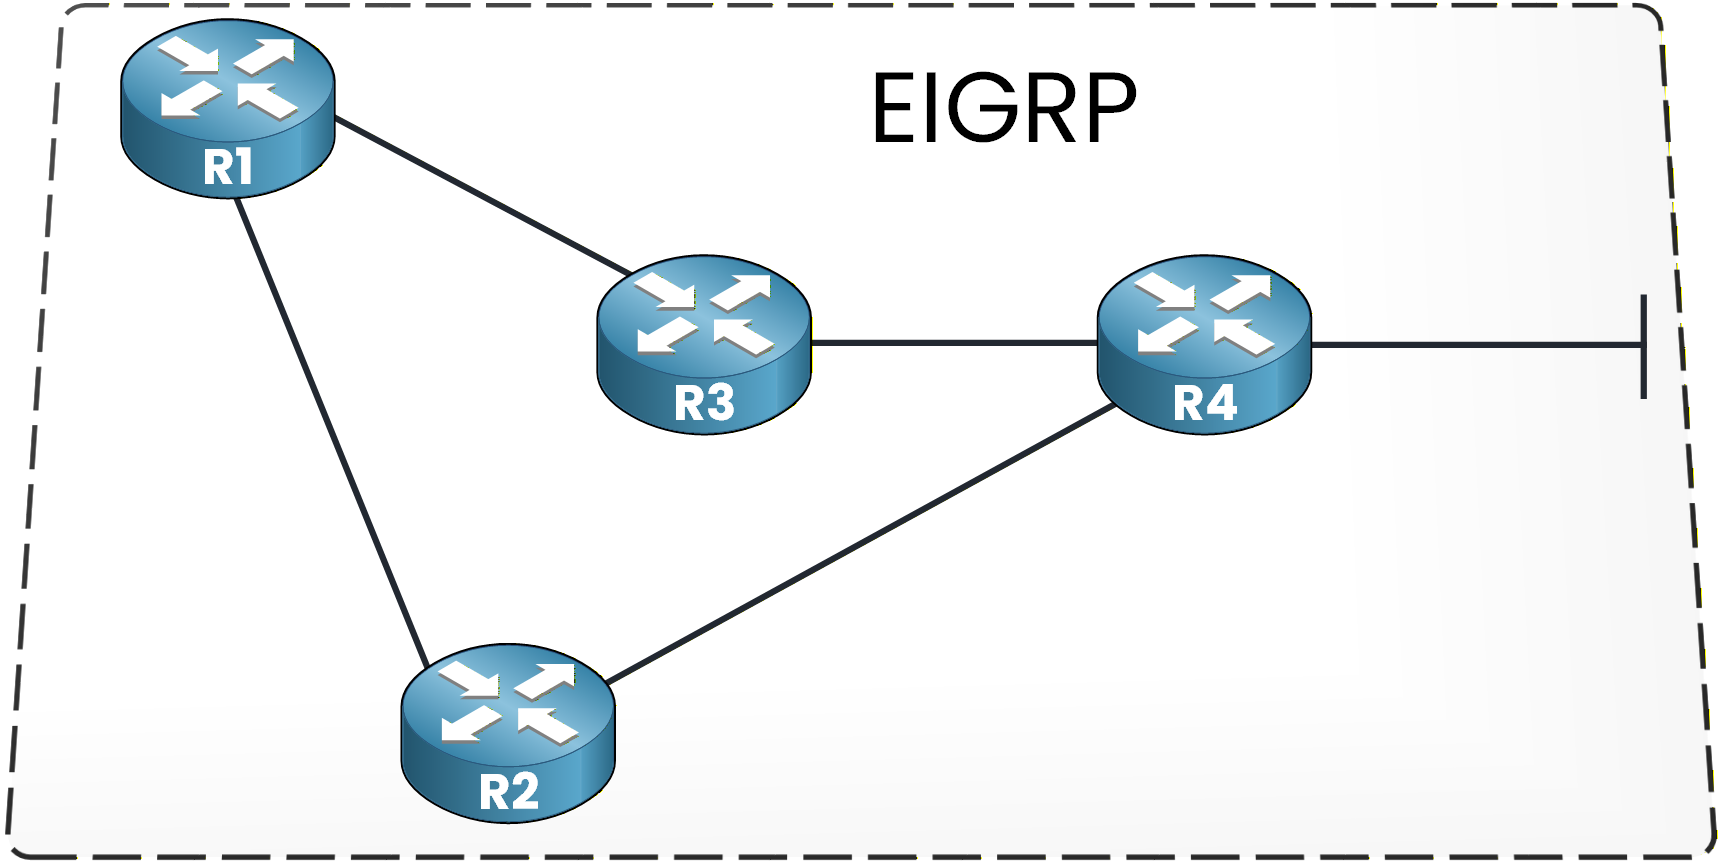
Figure 1 – Basic EIGRP topology
EIGRP Metric Weights (K-Values)
When EIGRP is enabled, you can verify the metric weights:
R1# show ip protocols
Routing Protocol is "eigrp 1"
  Outgoing update filter list for all interfaces is not set
  Incoming update filter list for all interfaces is not set
  Default networks flagged in outgoing updates
  Default networks accepted from incoming updates
  EIGRP metric weight K1=1, K2=0, K3=1, K4=0, K5=0
EIGRP defines five metric weights called K-values:
K1: Bandwidth
K2: Load
K3: Delay
K4: Reliability
K5: Reliability
Each K-value determines whether a specific component is included in the metric calculation and how it influences the final result.
By default:
K1 = 1
K3 = 1
K2, K4, K5 = 0
This means that, in a standard production network, only bandwidth and delay are used to calculate the metric.
Load and reliability exist in the formula but are not considered unless the K-values are manually modified, which must be consistent across all EIGRP routers.Answer the question below
Which K-value represents bandwidth?
EIGRP Formula
EIGRP uses a mathematical formula to calculate the metric of each path.
You do not need to memorize the full formula.
You simply need to understand that multiple interface characteristics can influence the final metric value.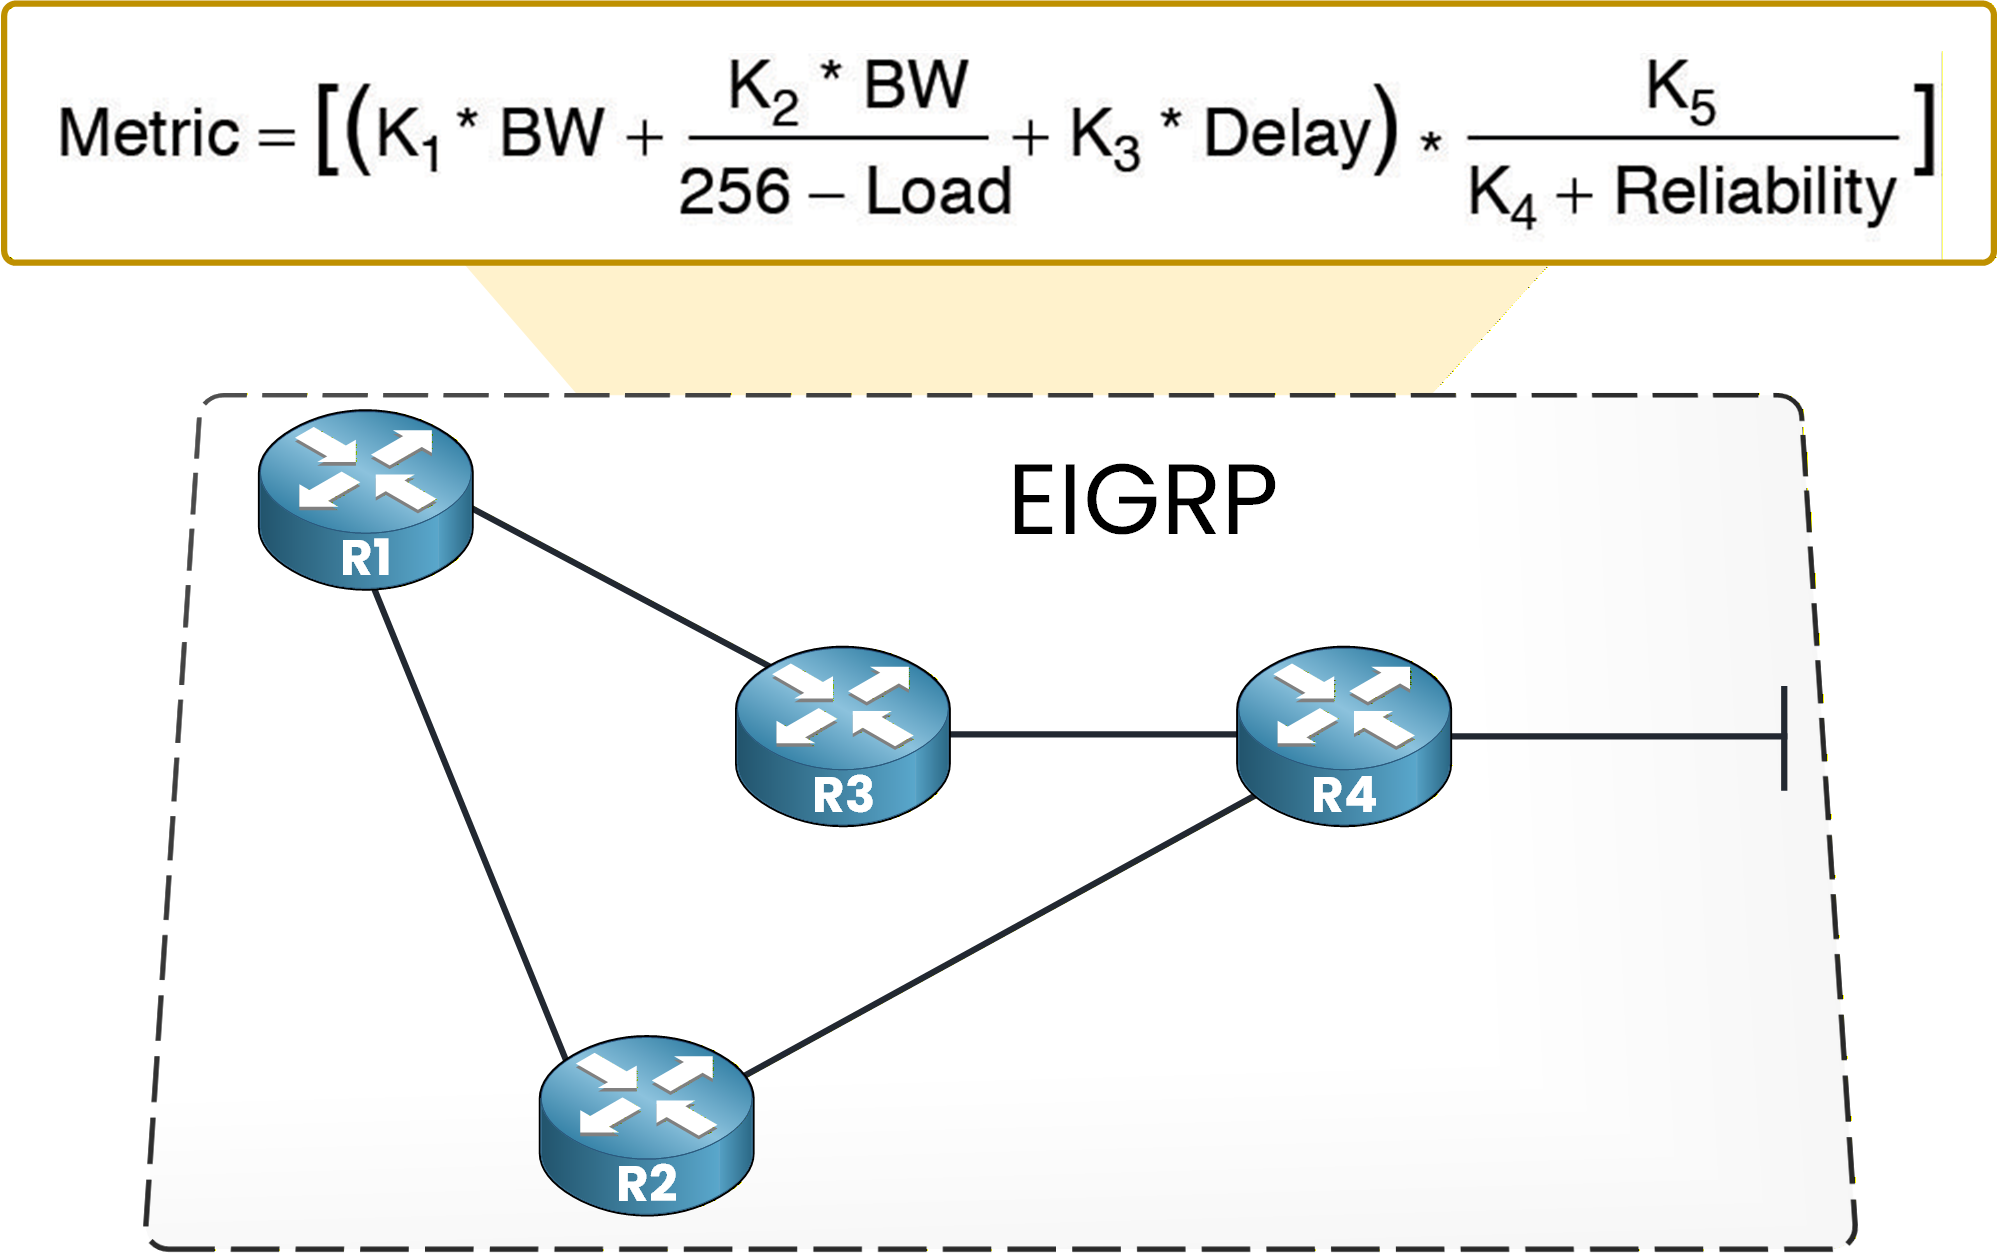
Figure 2 – Full EIGRP metric formula with K-values
This figure shows the complete classic EIGRP formula including all K-values.
It may look complex, but with default settings the formula becomes much simpler.Default EIGRP Metric Formula
When the default K-values are applied (K1 = 1 and K3 = 1), the formula simplifies to:

Figure 3 – Default EIGRP metric formula (bandwidth and delay)
With default K-values, the metric is calculated using only two components:
Minimum Bandwidth
Total Delay
Focus on understanding the logic rather than the math.
Minimum Bandwidth represents the slowest link along the entire path.
This is the bottleneck link. Even if all other links are fast, one slow link increases the overall metric.
Total Delay is the sum of all outgoing interface delays along the path.
Unlike bandwidth, delay accumulates at every hop.
The final result is multiplied by 256, a scaling factor inherited from IGRP.
In simple terms:
Bandwidth penalizes slow links.
Delay accumulates hop by hop.
The lowest resulting metric wins.
This is how EIGRP evaluates overall path quality.
Answer the question below
Which metric component represents the slowest link along the entire path?
Practical Example
If:
The minimum bandwidth along the path is 1,000,000 kbps (1 Gbps)
The total delay is 30 µs
Then EIGRP applies the default formula and calculates the metric accordingly.
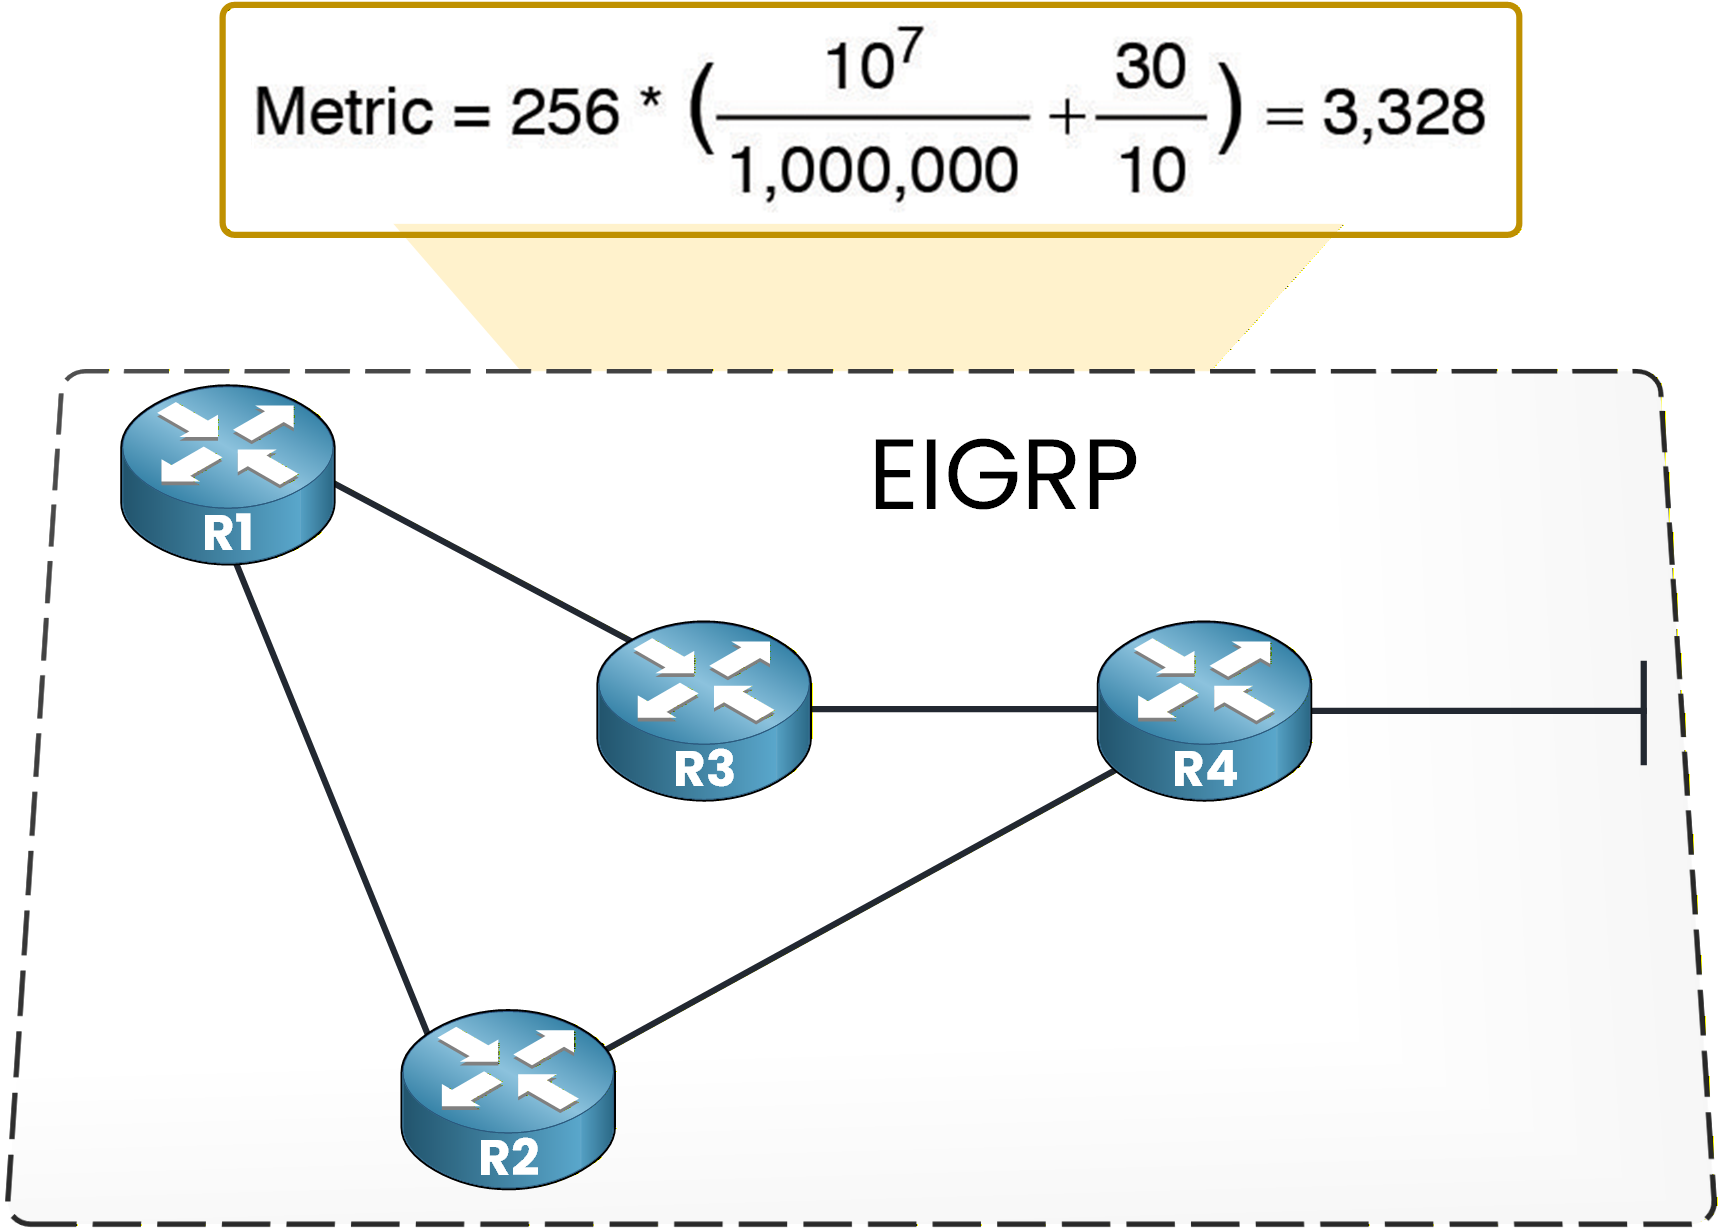
Figure 4 – Numerical example of EIGRP metric calculation
The resulting value is what EIGRP uses to compare this path against other possible paths.
Answer the question below
What is the minimum bandwidth value used in this example (in kilobits)?
By default, EIGRP uses bandwidth and delay to calculate the metric value.
The table below shows the default bandwidth, delay, and resulting EIGRP metric for common interface types.Default Values by Interface Type
Interface Category
Bandwidth (kbps)
Default Delay (µs)
EIGRP Metric Value
Serial Link
64
20,000
40,512,000
T1 Line
1,544
20,000
2,169,856
Ethernet
10,000
1,000
281,600
Fast Ethernet
100,000
100
28,160
Gigabit Ethernet
1,000,000
10
2,816
10-Gigabit Ethernet
10,000,000
10
512
Table 1 – Default EIGRP Metric Values by Interface Type
From this table, you can observe a clear pattern:
As interface bandwidth increases, the EIGRP metric decreases.
Faster links produce lower metrics.
Slower links significantly increase the metric.
EIGRP Path Attributes
To calculate the total cost of a path, EIGRP relies on attribute propagation.
EIGRP does not calculate the entire path metric from scratch at every router.
Instead, it propagates path attributes inside update packets.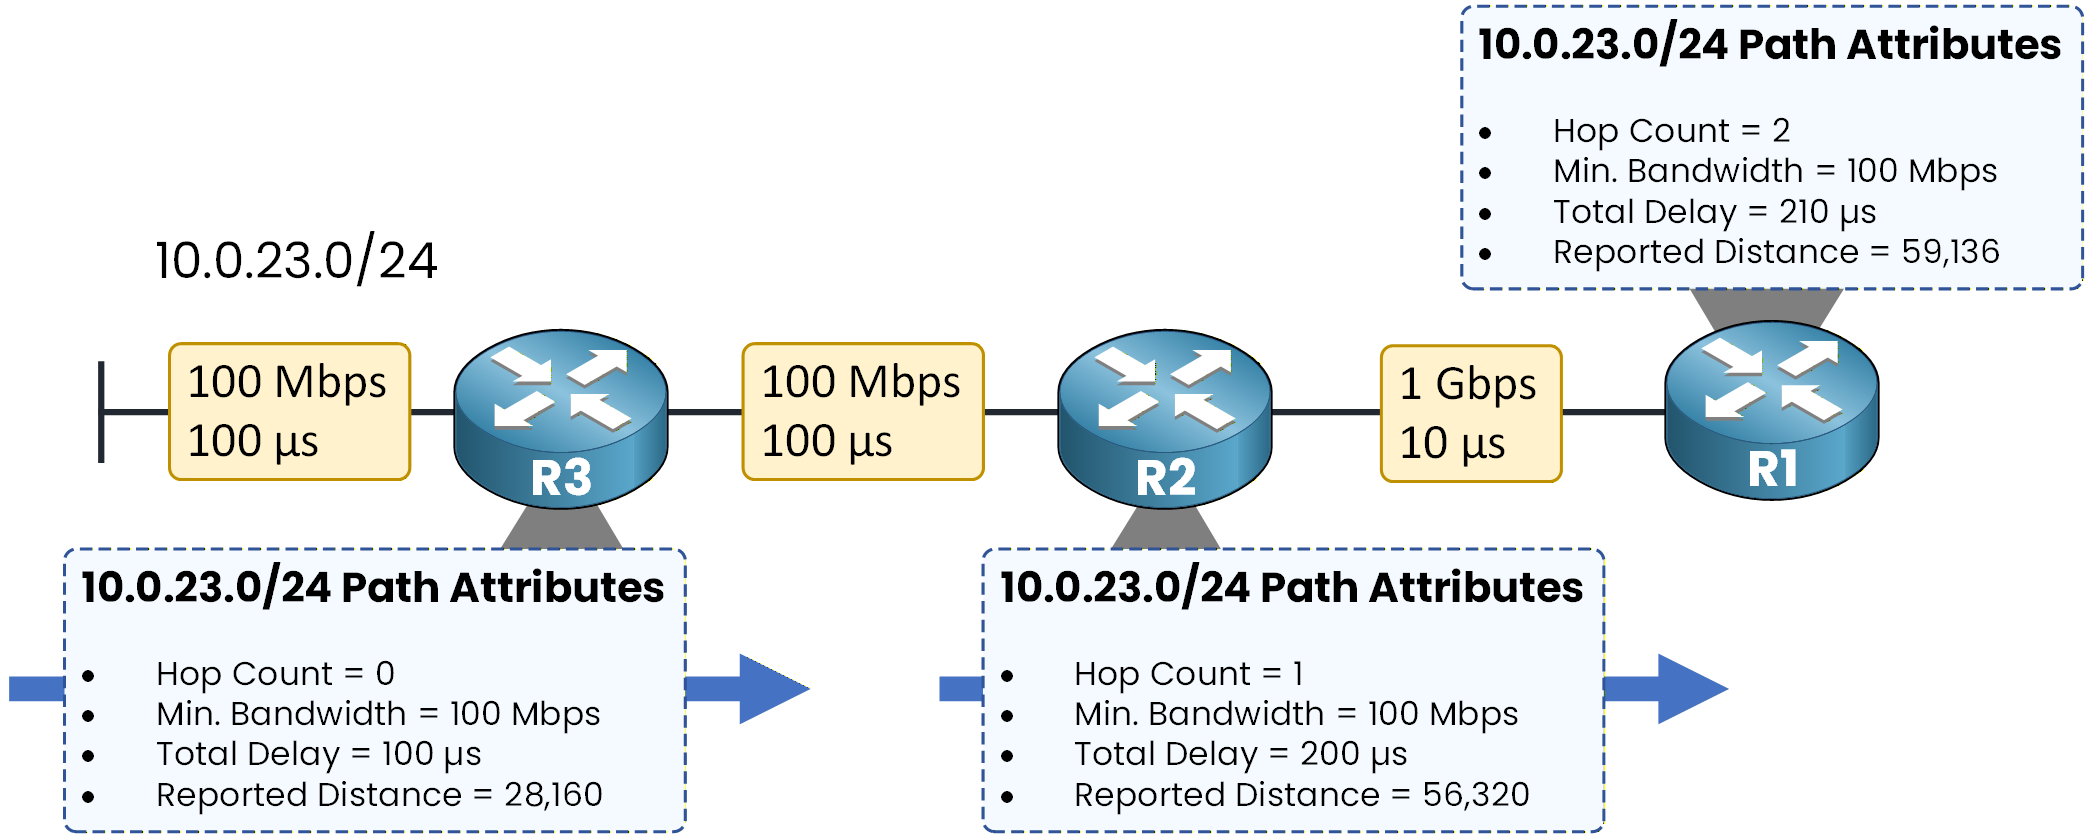
Figure 5 – EIGRP Path Attribute Propagation for 10.0.23.0/24
Each update contains:
Hop Count
Minimum Bandwidth
Total Delay
Reported Distance (RD)
Every router that receives an update:
Increments the hop count
Updates the minimum bandwidth (if its outgoing link is slower)
Adds its own interface delay to the total delay
Recalculates the metric
This is how EIGRP builds the path cost step by step.
The next lesson shows where this formula stops working: at 10 Gbps.
Answer the question below
Which metric component accumulates at every hop along the path?