It is Monday morning and a user calls you.
"I can't reach the file server anymore. It worked on Friday."
You sit down at your console.
Three routers stand between the user and the server, and any of them could be the cause.The Lab
PC1 lives in 10.10.10.0/24 and the server SRV lives in 10.20.20.0/24.

Figure 1 – Lab topology from PC1 to the application server
R1 is the user gateway, R2 is the core, R3 is the data center edge.
The break can be anywhere along that chain.
In this lesson we will see a method that does not waste time, and make sure you use the right tool to answer the right question.Answer the question below
How many routers stand between PC1 and SRV?
The Method
In networking, troubleshooting can be very complex.
But having a view on all the tools you have is a great start.
Look at the diagram below:
Figure 2 – The five-step troubleshooting flow
Here you can see multiple tools you can use as a network engineer to make sure you are troubleshooting efficiently. Let's go step by step.
You will troubleshoot with me, step by step.
The first one is ping.Answer the question below
Which step comes right after confirming the problem with ping?
The first task you can do when a network problem occurs is to confirm the problem exists.
The user might have made a mistake. The cable might be loose. The server might be fine.
You can log into R1 and send your own packet across the network.
This is what ping does.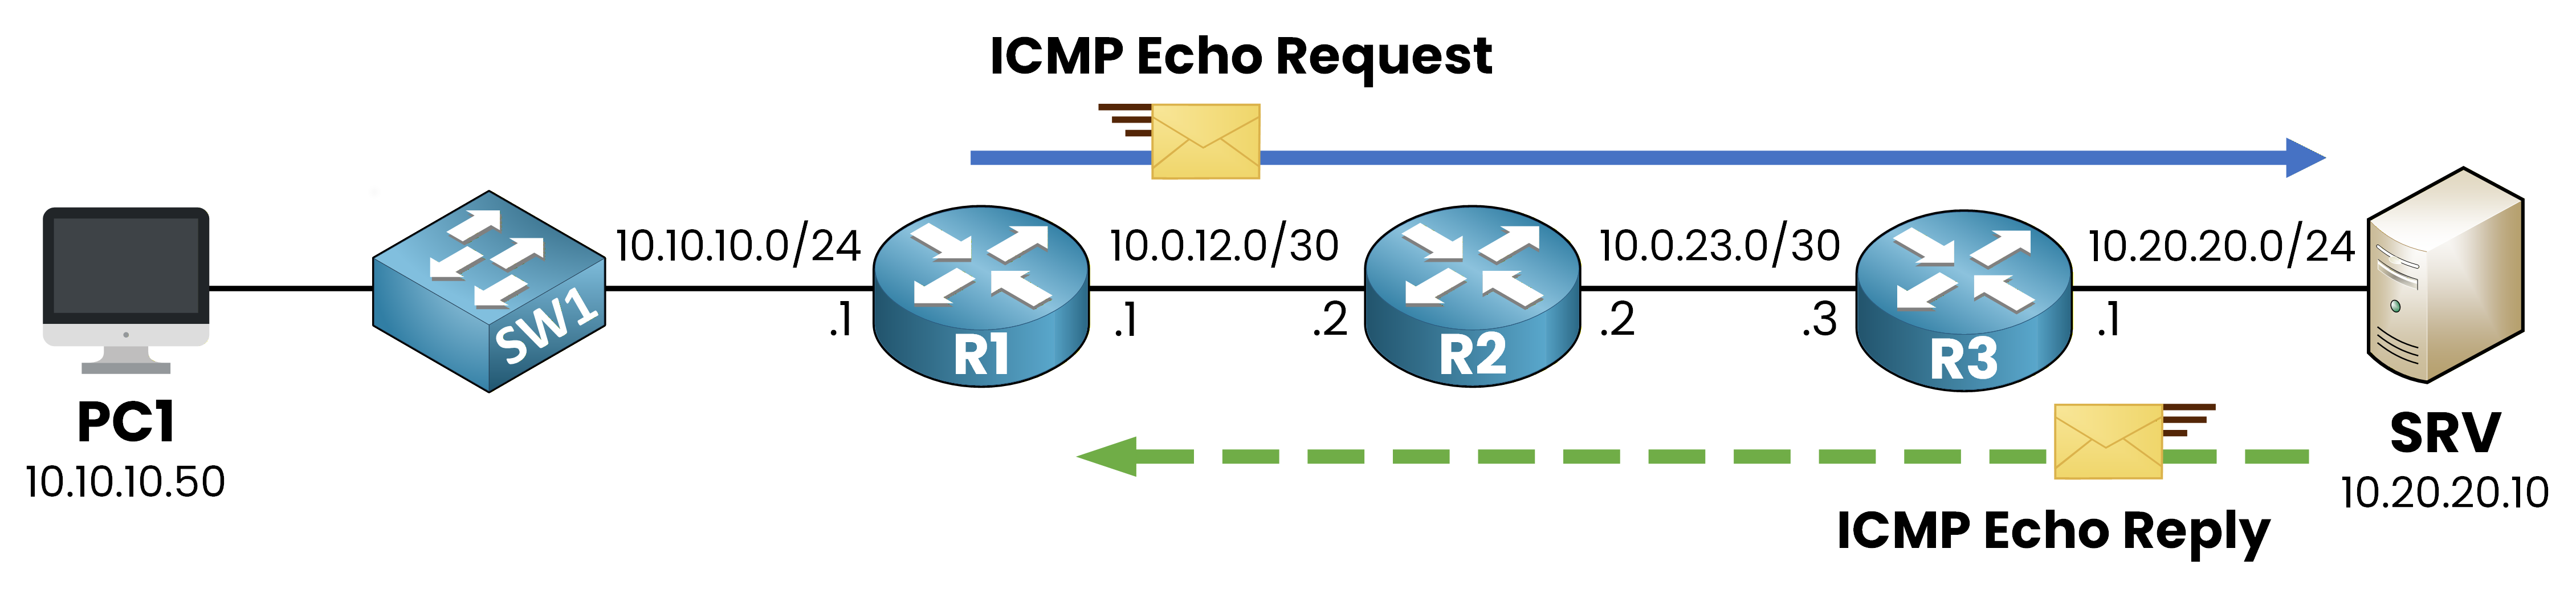
Figure 3 – Ping echo request and reply across the topology
The ICMP echo request leaves R1, crosses R2, then R3, and lands on SRV.
If the server is operational and the path is functioning in both directions, an echo reply will be sent back in the same way, as shown in the figure.Run a basic ping toward the server.
R1# ping 10.20.20.10
Type escape sequence to abort.
Sending 5, 100-byte ICMP Echos to 10.20.20.10, timeout is 2 seconds:
.....
Success rate is 0 percent (0/5)
Here you see five dots and zero replies out of five.
The connectivity is broken.
You have your confirmation.
Now you need to find where.Answer the question below
Which tool do you use first to confirm a connectivity problem?
Ping told you the path is broken.
You still do not know where.
That is what traceroute answers.Traceroute
Traceroute is clever.
It does not ask the routers along the path to identify themselves.
Instead, it sends probes with a Time To Live (TTL) that increases by one each time.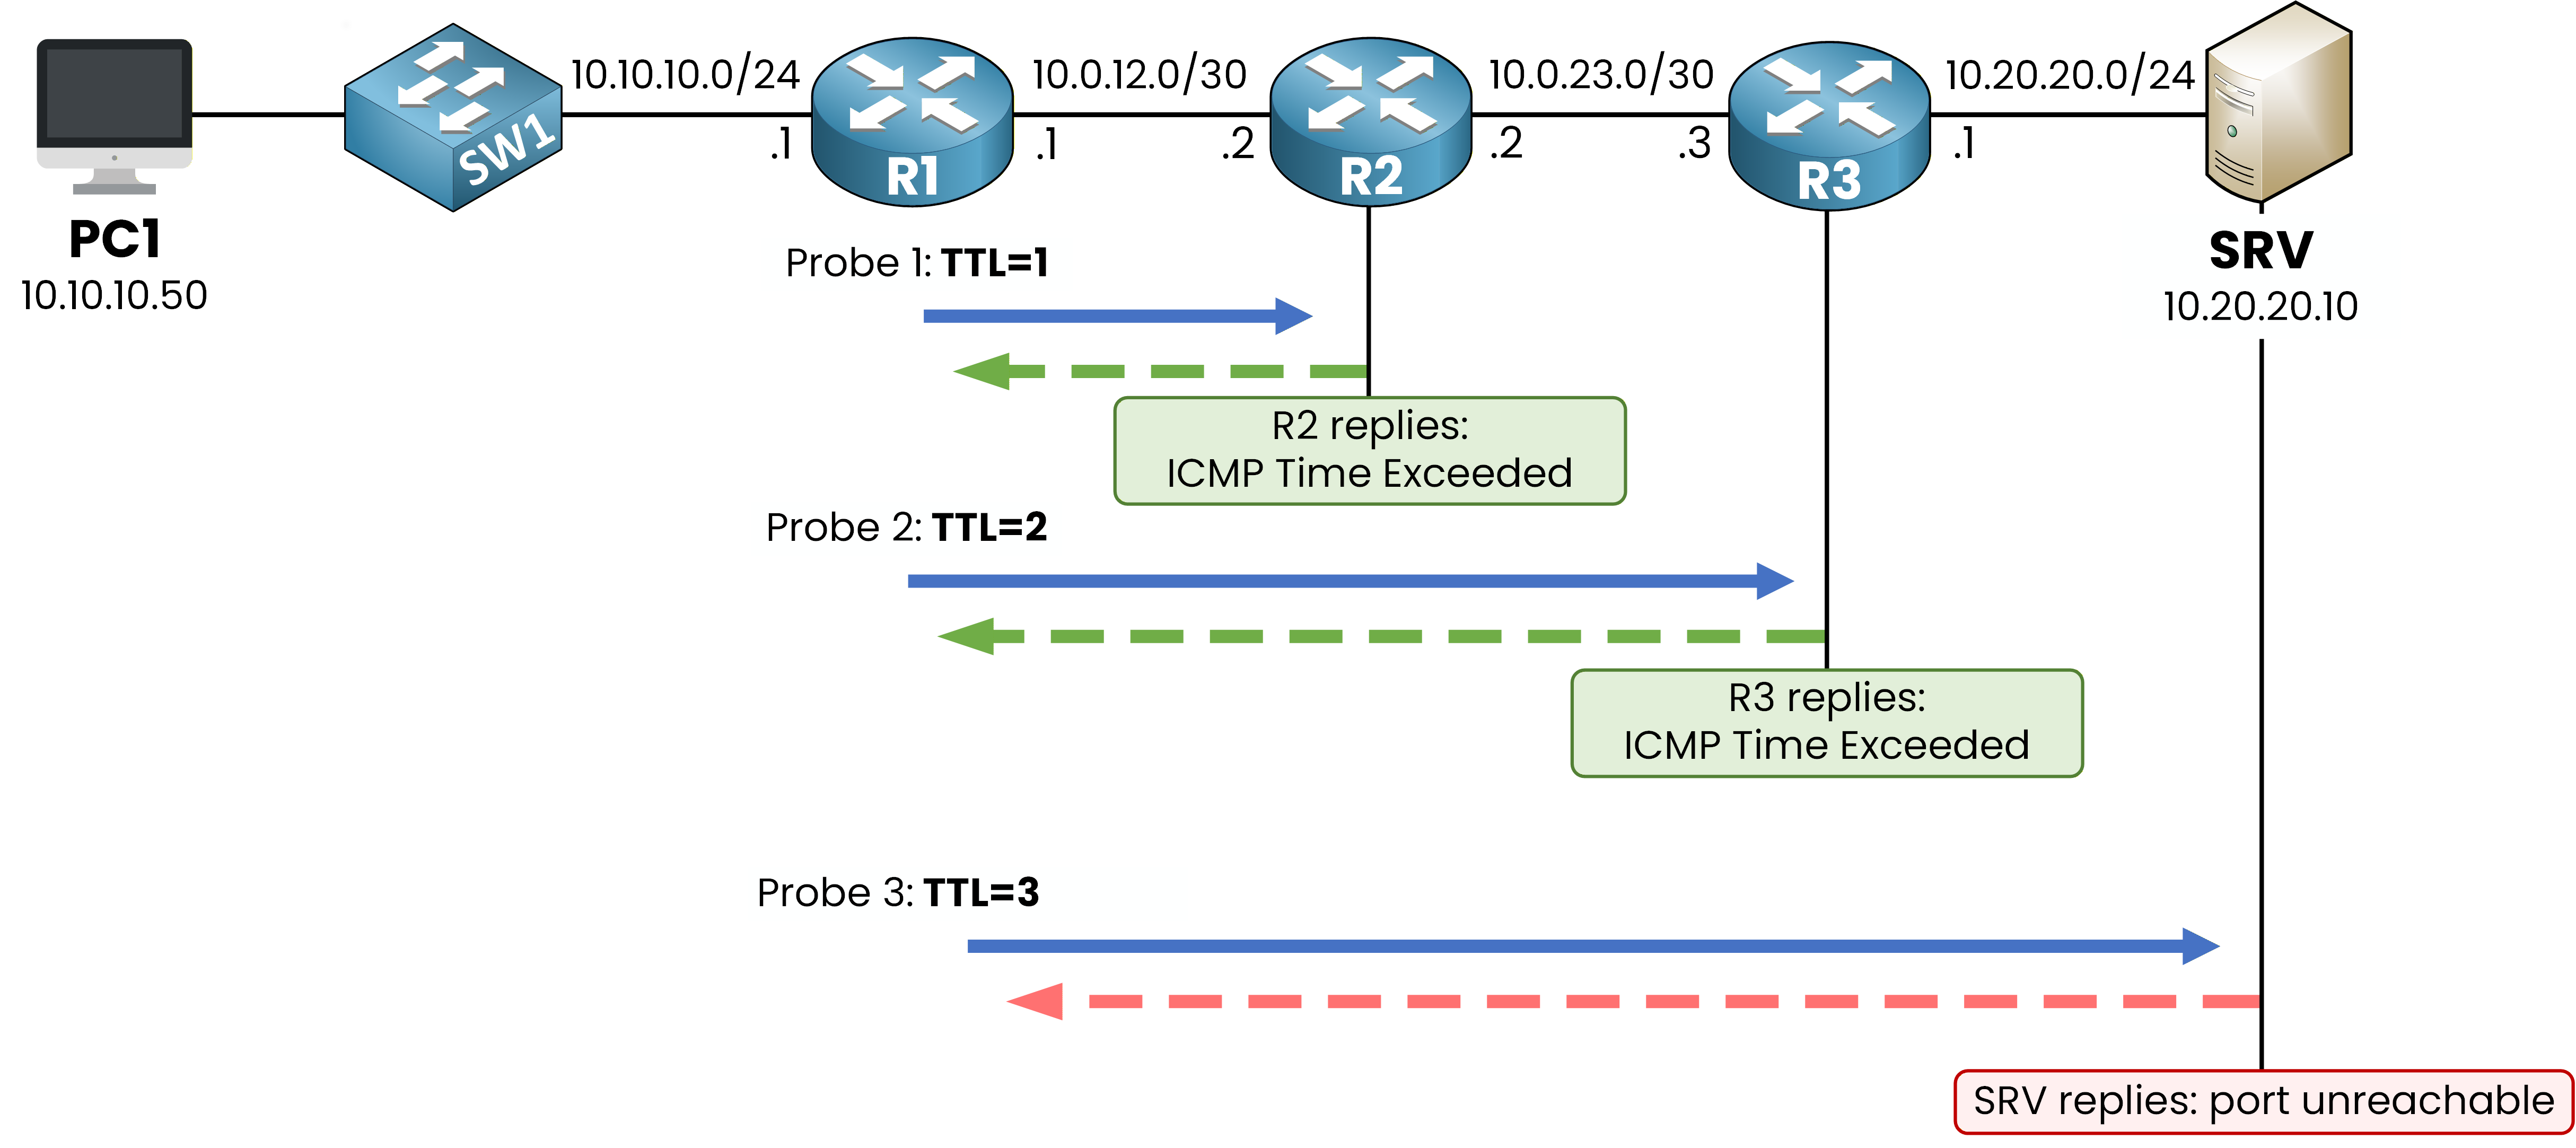
Figure 4 – Each probe goes one router further before the TTL expires
The TTL is a number carried in every IP packet.
Each router that forwards the packet decreases this number by one.
When the TTL reaches 0, the router drops the packet and tells the sender about it with an ICMP Time Exceeded message.
The TTL was originally designed to prevent packets from looping forever in the network.
But traceroute uses this exact mechanism in a clever way to discover the path step by step.Answer the question below
Which ICMP message does a router send when the TTL reaches 0?
Traceroute Flow
The first probe leaves R1 with TTL = 1.
R2 receives it, decrements the TTL to 0, drops the packet, and sends back an ICMP Time Exceeded.
That is how R1 learns R2 is the first hop.The second probe leaves with TTL = 2.
It dies on R3, which reveals itself.
The third probe with TTL = 3 makes it all the way to the destination.
Run it from R1.
R1# traceroute 10.20.20.10
Type escape sequence to abort.
Tracing the route to 10.20.20.10
  1 10.0.12.2 4 msec 4 msec 4 msec
  2 10.0.23.3 8 msec 8 msec 8 msec
  3  *  *  *
  4  *  *  *
  5  *  *  *
Hop 1 is R2 at 10.0.12.2.
Hop 2 is R3 at 10.0.23.3.
Both reply within milliseconds.
From hop 3 onward, you only see stars.Answer the question below
What does a star mean in a traceroute hop?
Reading the Stars
A star is not always a dead router.
The probe might have reached the next hop, but the reply was filtered.Three causes are common when stars appear after a successful chain of hops:
an ACL is dropping ICMP on the next router
a route is missing toward the destination subnet, so R3 has nowhere to forward the probe
the next-hop device exists but is configured to not reply to ICMP
In your case, the chain stops right after R3.
R3 is the last router that responds.
Whatever happens on R3 is the next thing to investigate.Answer the question below
Where does your investigation continue after this traceroute?
Traceroute pointed at R3.
You log into R3 and you want to see what it actually does with the packets it receives.That is the job of debug.
A debug command prints, as it happens, what the router is doing for a given subsystem.
Reading A Debug Line
Before you point a debug at packets going through R3, look at what a debug output looks like.
You can target a debug by event type. Let's take an example with OSPF adjacency events on G0/0, the interface toward R2.R3# debug ip ospf adj OSPF adjacency events debugging is on *Mar 1 09:14:22.451: OSPF-1 ADJ Gi0/0: Rcv DBD from 10.0.23.2 seq 0x1ABF opt 0x52 flag 0x7 len 32 mtu 1500 state EXSTART *Mar 1 09:14:22.453: OSPF-1 ADJ Gi0/0: NBR Negotiation Done. We are the SLAVE *Mar 1 09:14:22.455: OSPF-1 ADJ Gi0/0: Send DBD to 10.0.23.2 seq 0x1ABF opt 0x52 flag 0x2 len 92Each line follows the same format:
a timestamp at the start, like
*Mar 1 09:14:22.451a subsystem and event class, here
OSPF-1 ADJthe interface and the message itself, here
Gi0/0: Rcv DBD from 10.0.23.2
You read the lines top to bottom.
Here you see DBD packets going back and forth, the neighbor R2 at 10.0.23.2 talking, the adjacency forming.
OSPF on this link is fine.Answer the question below
Which element appears at the start of every debug line?
The Danger Behind Debug
Targeted debugs like
debug ip ospf adjgenerate a few lines per second.But some debugs cover every IP packet the router handles.
On a production router carrying gigabits of traffic, that means thousands of console lines per second.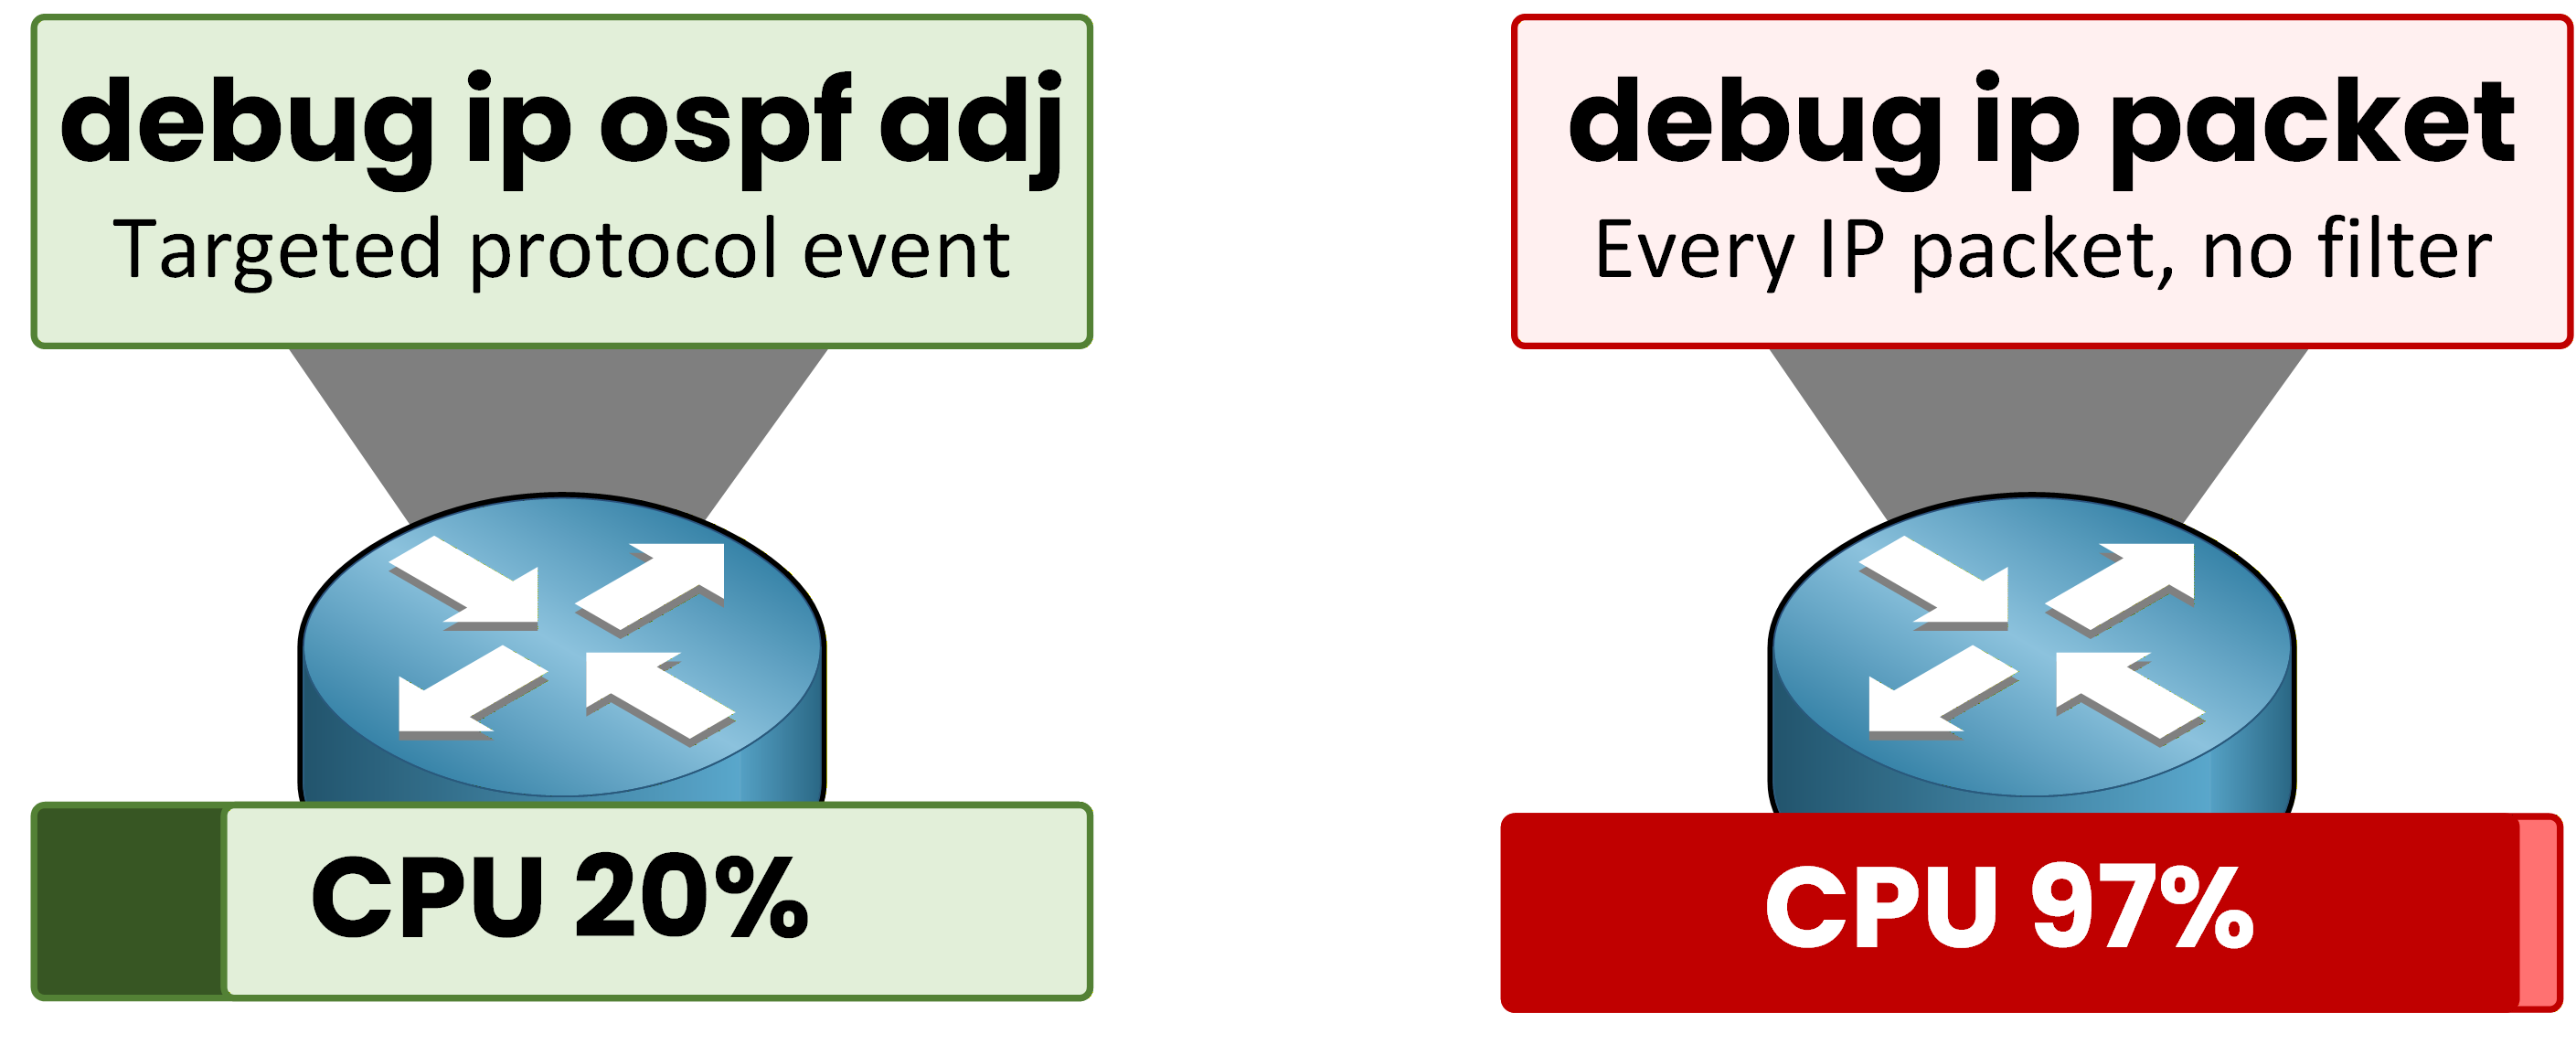
Figure 5 – A targeted debug stays safe. An unconditional debug ip packet melts the CPU.
On a busy router, an unconditional
debug ip packetcan push CPU close to 100 percent.
Routing protocols time out. Your SSH session lags. The router can crash entirely.The lesson is simple. The more general the debug, the more dangerous it is.
Answer the question below
Which keyword scopes a debug to a single host?
You need to see what R3 does with packets coming from PC1.
Butdebug ip packeton the whole router would crash production.The fix is to attach an ACL to the debug.
How The ACL Filter Works
The ACL becomes a filter. Only packets matching it produce debug output.
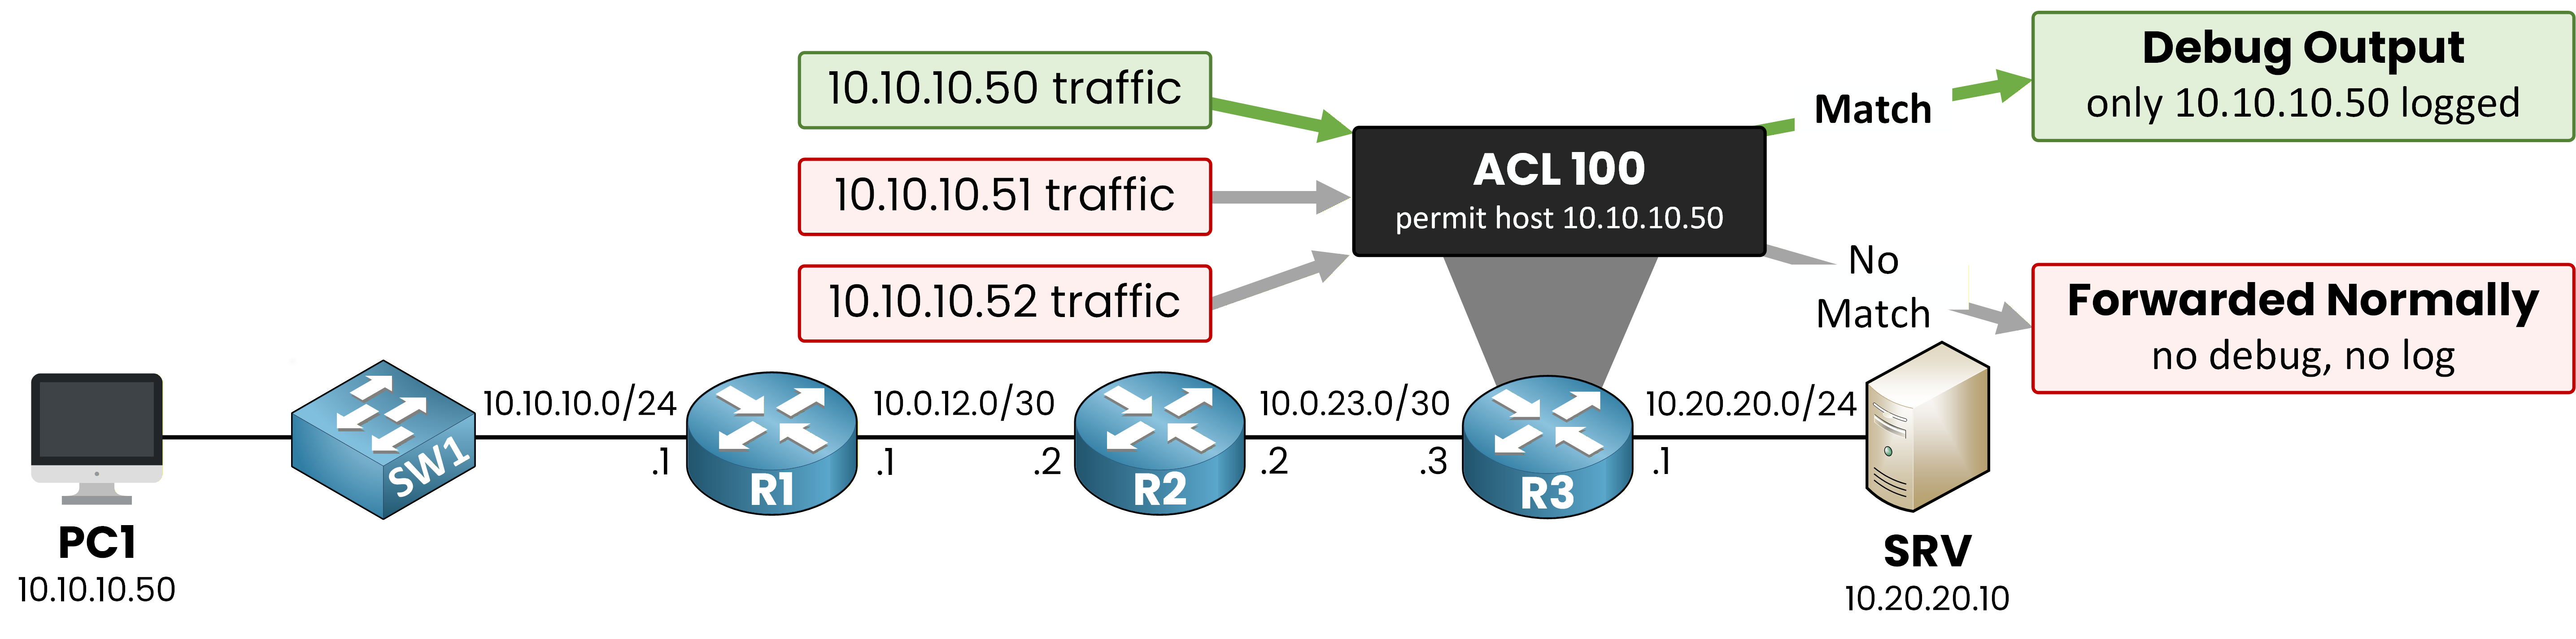
Figure 6 – The ACL filters what the debug sees, not what the router forwards
Everything else is forwarded normally, with no log line.
Building The Filter
PC1 is at 10.10.10.50.
Build an extended ACL that matches any IP packet from that host.
The ACL number 100 puts it in the extended range, which packet debugs require.R3# conf t Enter configuration commands, one per line. End with CNTL/Z. R3(config)# access-list 100 permit ip host 10.10.10.50 any R3(config)# endACL 100 permits any IP packet sourced from 10.10.10.50 to any destination.
Now you tie this ACL to a packet debug.R3# debug ip packet 100 IP packet debugging is on for access list 100 *Mar 1 09:21:02.118: IP: s=10.10.10.50 (GigabitEthernet0/0), d=10.20.20.10, len 60, access denied by inbound ACL on GigabitEthernet0/1Look at this debug output: R3 receives a packet from PC1 and tells you exactly what happens.
The packet was denied by an inbound ACL on G0/1, which is the interface toward SRV.
You found the cause.
Yesterday this user was reaching the server without any issue, so something must have changed during the night.
Let's check what ACL is applied on G0/1 and what it allows.R3# show ip interface g0/1 | include access list Outgoing access list is not set Inbound access list is HARDEN_DC R3# show access-lists HARDEN_DC Extended IP access list HARDEN_DC 10 permit ip 10.40.40.0 0.0.0.255 any 20 permit ip 10.50.50.0 0.0.0.255 any 30 deny ip any any logLooking at the ACL, you can see that a colleague applied HARDEN_DC last night to harden the access toward the data center.
The ACL was meant to allow only a few specific subnets, but the user subnet 10.10.10.0/24 was forgotten in the permit list.
The implicit deny at line 30 drops everything else, including the user's traffic.The fix is simple: you add a permit line for the user subnet before the deny.
R3# conf t
Enter configuration commands, one per line.  End with CNTL/Z.
R3(config)# ip access-list extended HARDEN_DC
R3(config-ext-nacl)# 25 permit ip 10.10.10.0 0.0.0.255 any
R3(config-ext-nacl)# end
The user can now reach the server again.
And during the whole investigation your CPU stayed calm, because only PC1's traffic matched the ACL filter you built.
The other thousands of flows on R3 were forwarded silently in the background.Answer the question below
What blocks PC1 traffic on R3 in the debug output?
You fixed the ACL.
The user is happy again.What To Do Before It Happens
But your boss asks the only question that matters:
"Why did we discover this through a user complaint?"The answer is monitoring.
You need the router to tell you something is wrong before users notice.Syslog
You have already seen these messages on the console.
They follow a strict format.*Mar 1 09:14:22.451: %LINK-3-UPDOWN: Interface GigabitEthernet0/1, changed state to downThe number between the two dashes is the severity level.
It tells you how urgent the message is.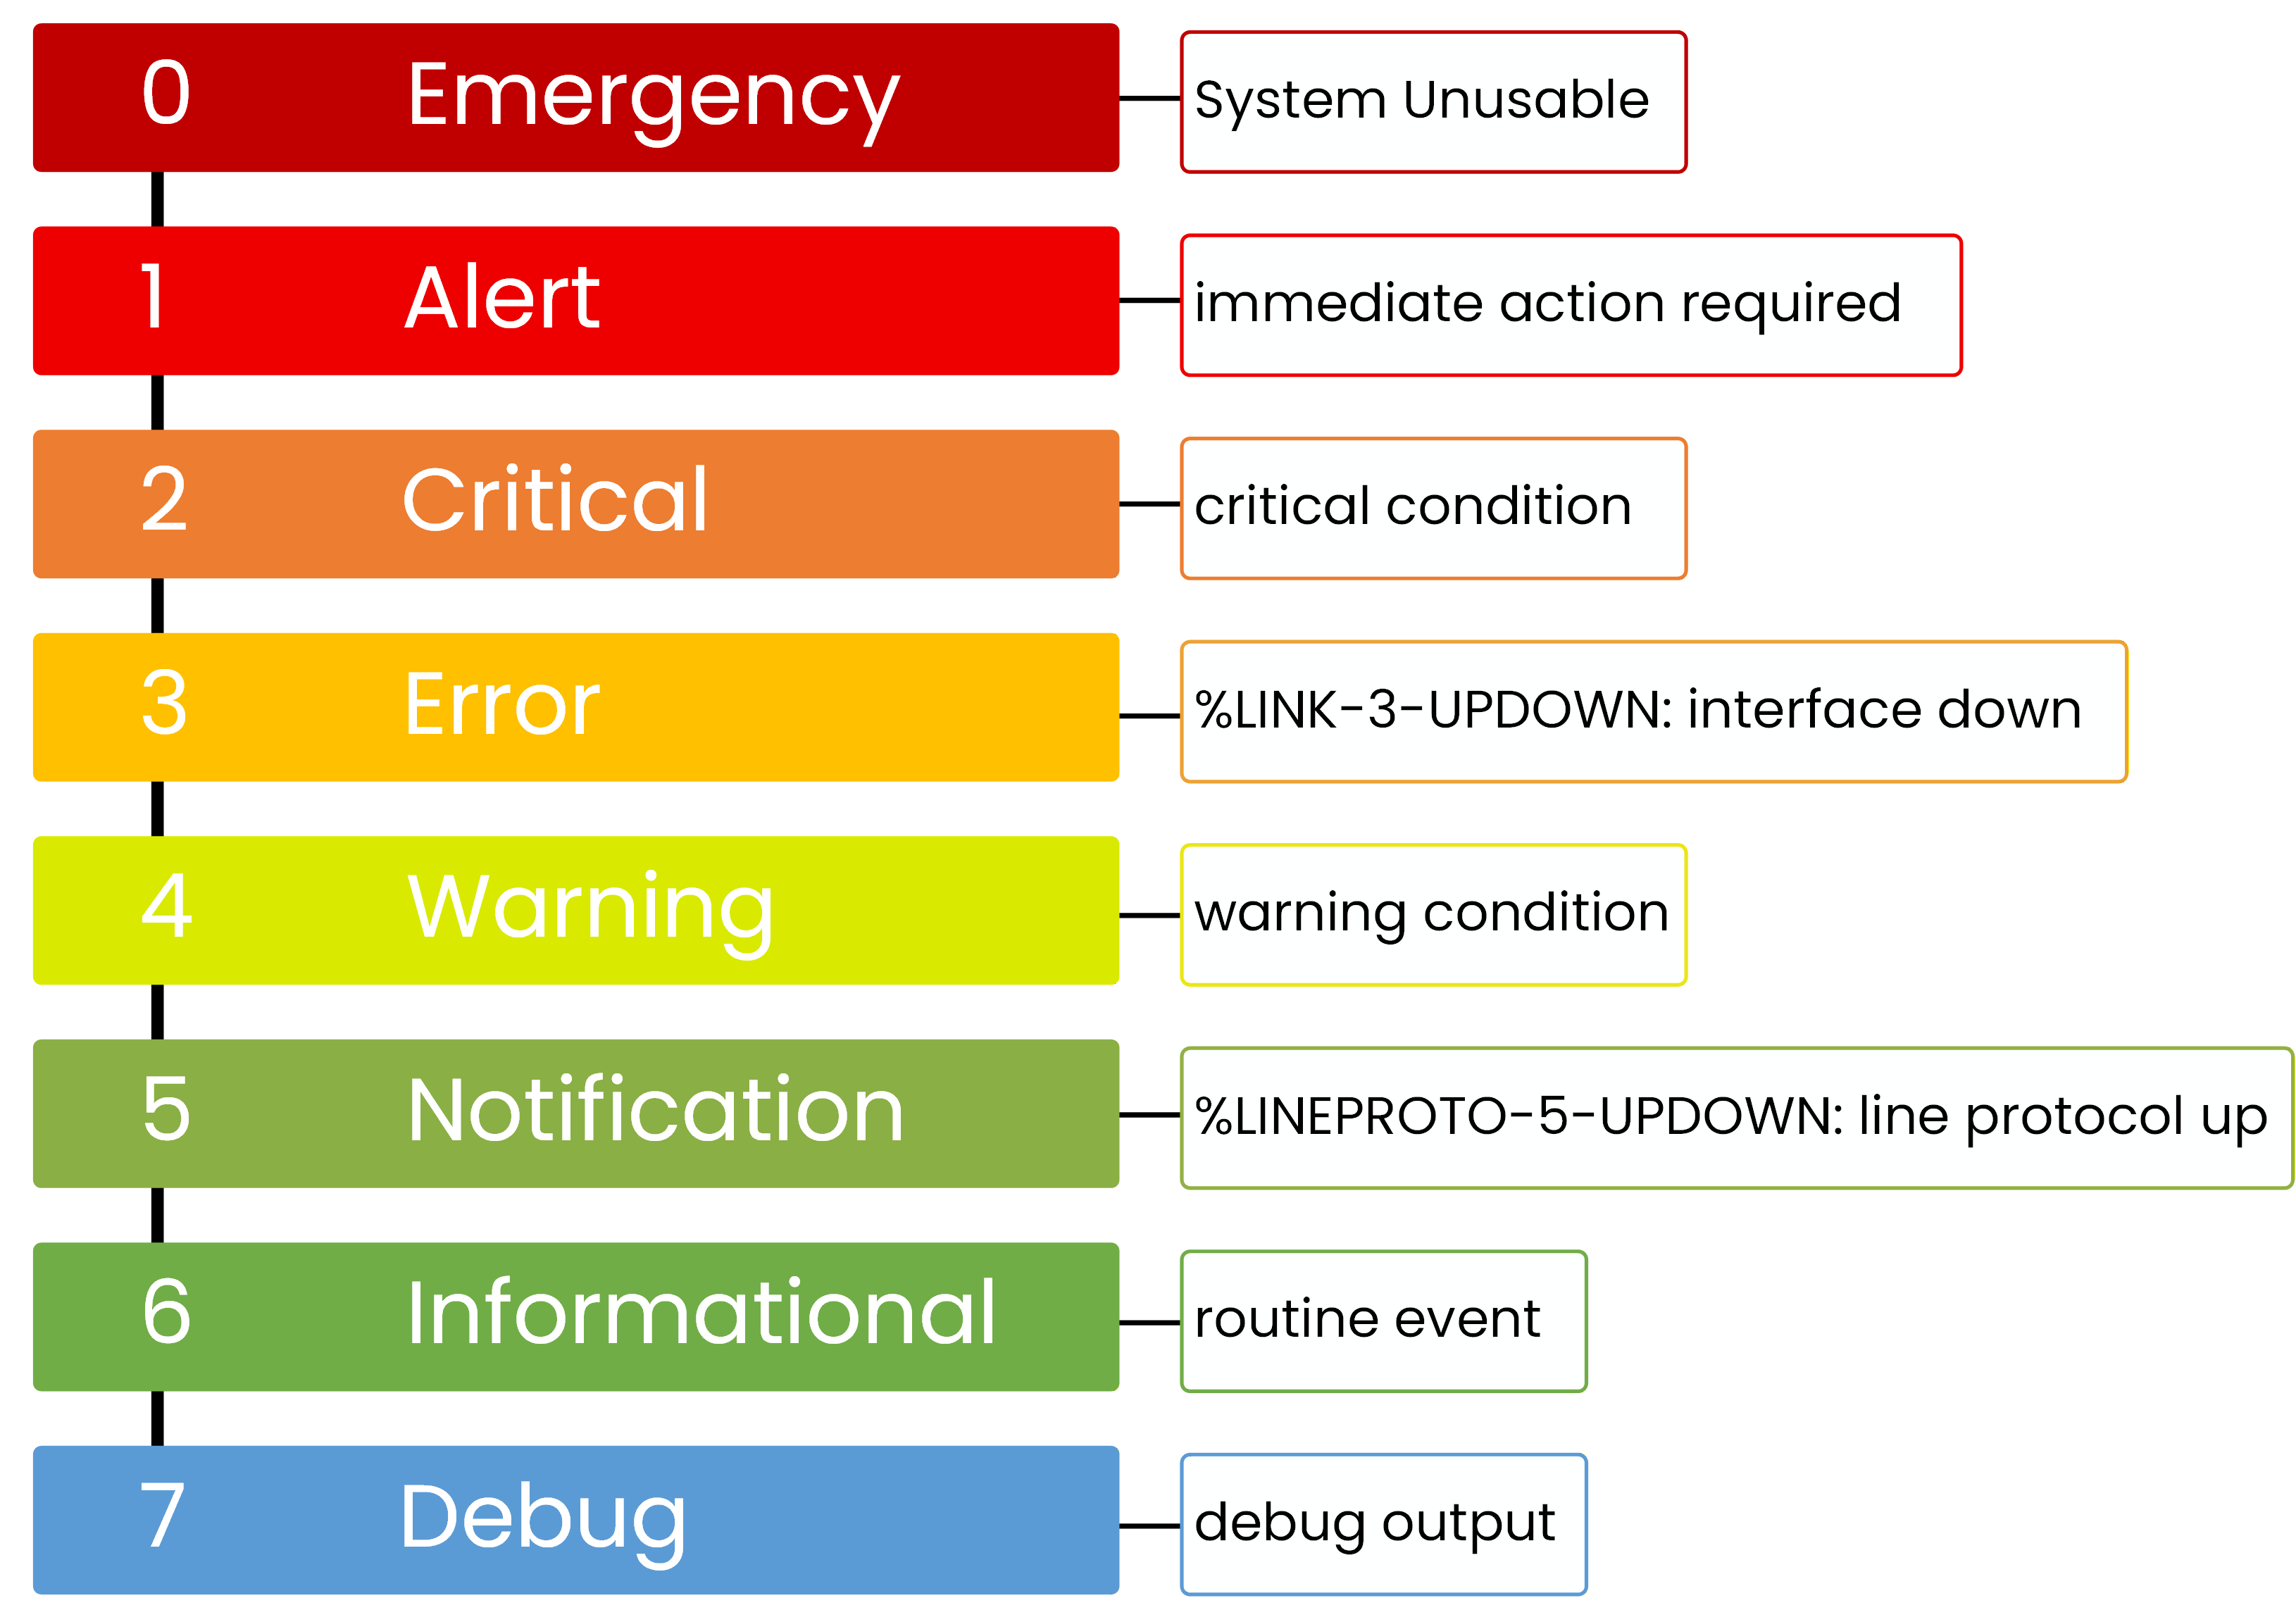
Figure 7 – Syslog severity levels
Two readings to remember:
%LINK-3-UPDOWN means severity 3, error
%LINEPROTO-5-UPDOWN means severity 5, notification
Lower number means more urgent.
Severity 0 is the worst, severity 7 is just chatter.Answer the question below
Which severity number is the most urgent?
Sending Logs To A Server
Console messages disappear when you log out.
To keep history and to centralize multiple devices, forward them to a syslog server.R3# conf t Enter configuration commands, one per line. End with CNTL/Z. R3(config)# logging host 10.50.50.10 R3(config)# logging trap 5 R3(config)# endlogging hostpoints to your syslog server.logging trap 5sends only severity 0 to 5, anything notification or worse.
The chatter at severity 6 and 7 stays local.
Answer the question below
Which command points your router to a syslog server?
SNMP
Syslog only fires when something happens.
An interface changes state, OSPF loses an adjacency, the config is saved.But what about CPU rising slowly toward 80 percent over four hours? Or memory leaking 50 MB per day?
None of that triggers a syslog message until it crashes.That gap is what SNMP fills.
Your monitoring server polls counters from the router on a schedule and stores them.
Trends show up before they become incidents.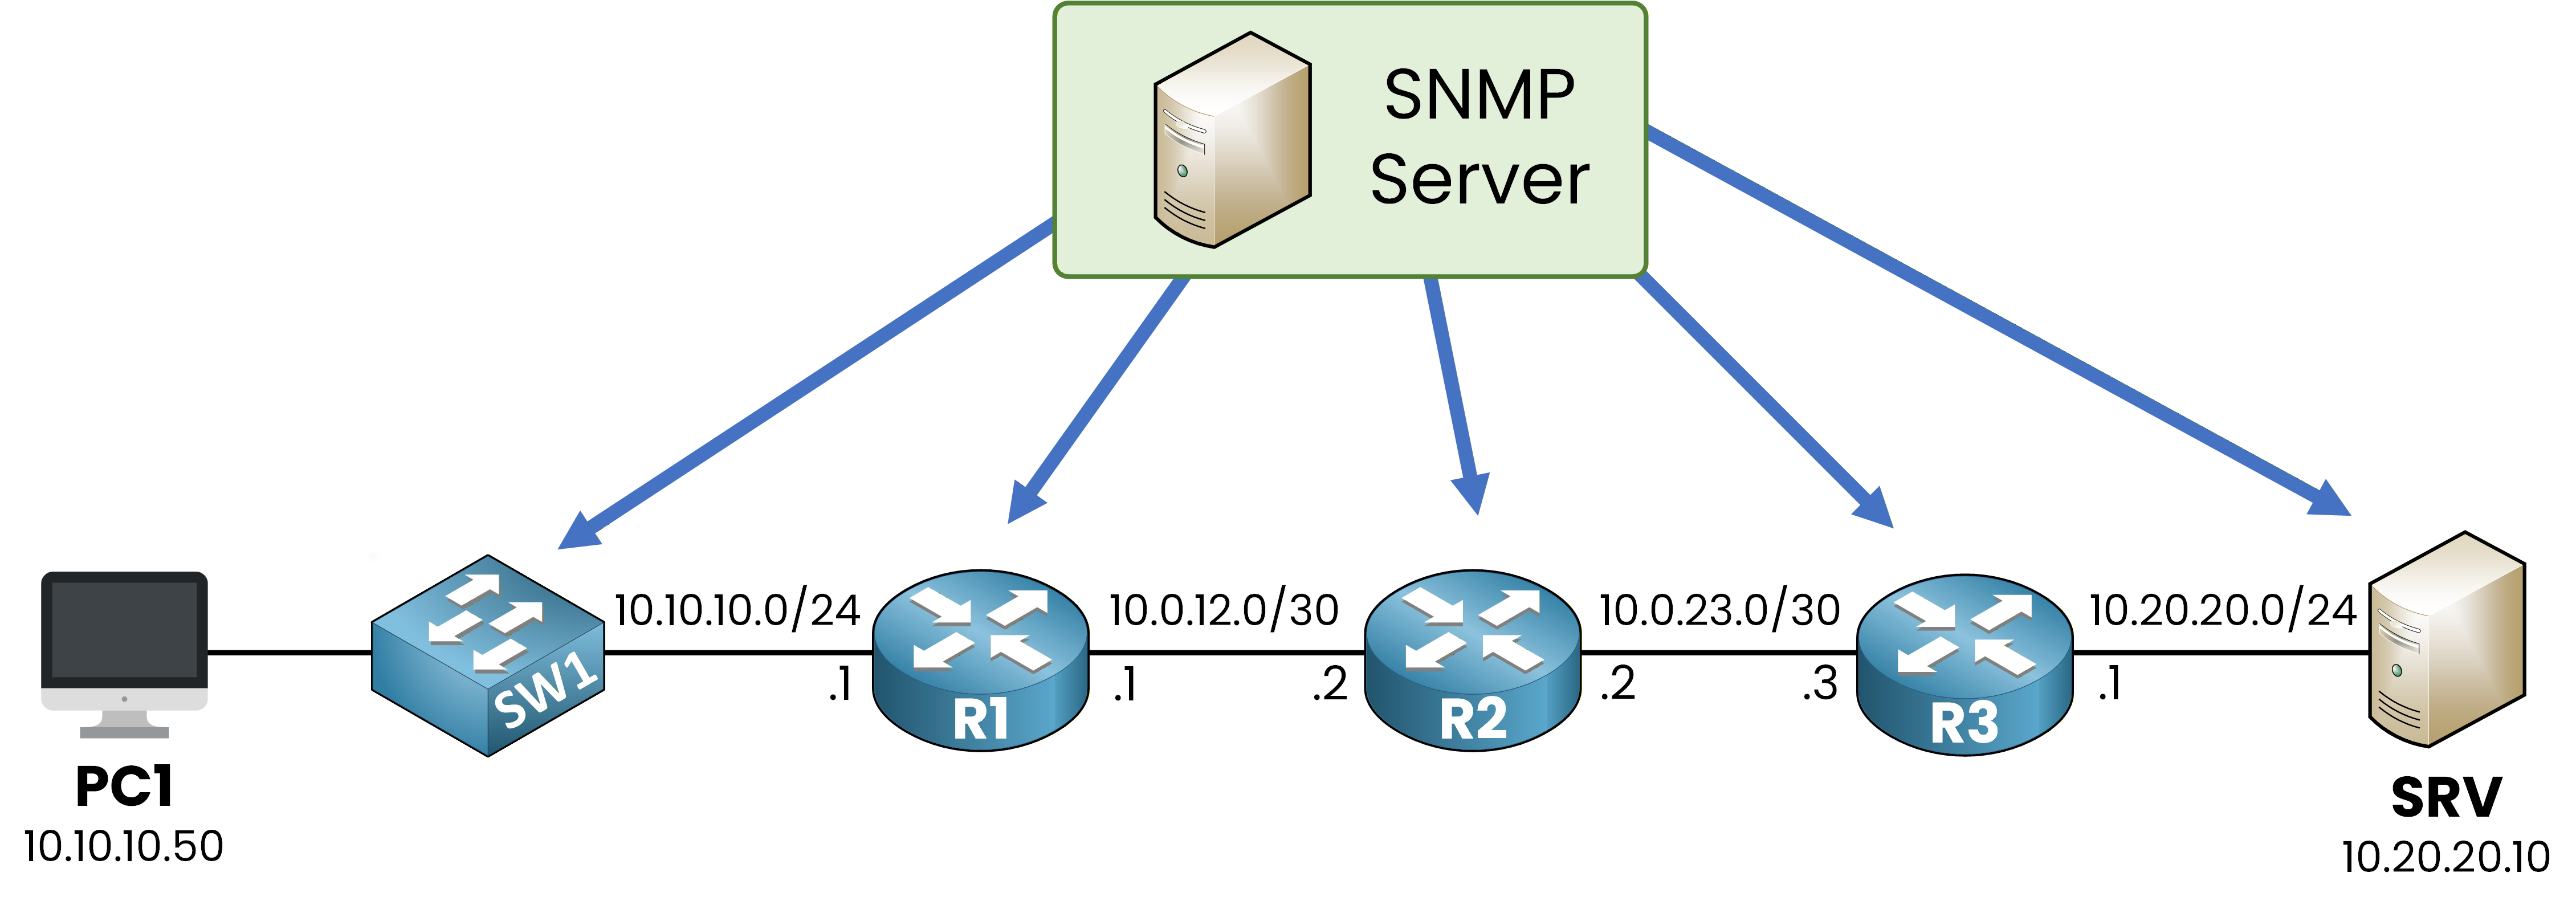
Figure 8 – The SNMP server polls every device on the network on a schedule
The SNMP server polls each network device on a regular schedule, every minute or every five minutes.
It does not poll user workstations, which are usually monitored by their own agents.Syslog is a push model: the router shouts when something changes.
SNMP is a pull model: the server asks every minute, even when nothing seems wrong.
You need both.
Syslog catches events. SNMP catches drifts.Answer the question below
Which protocol shows you slow trends like CPU rising over hours?