Introduction to QoS
Course Contents
1. What is QoS?
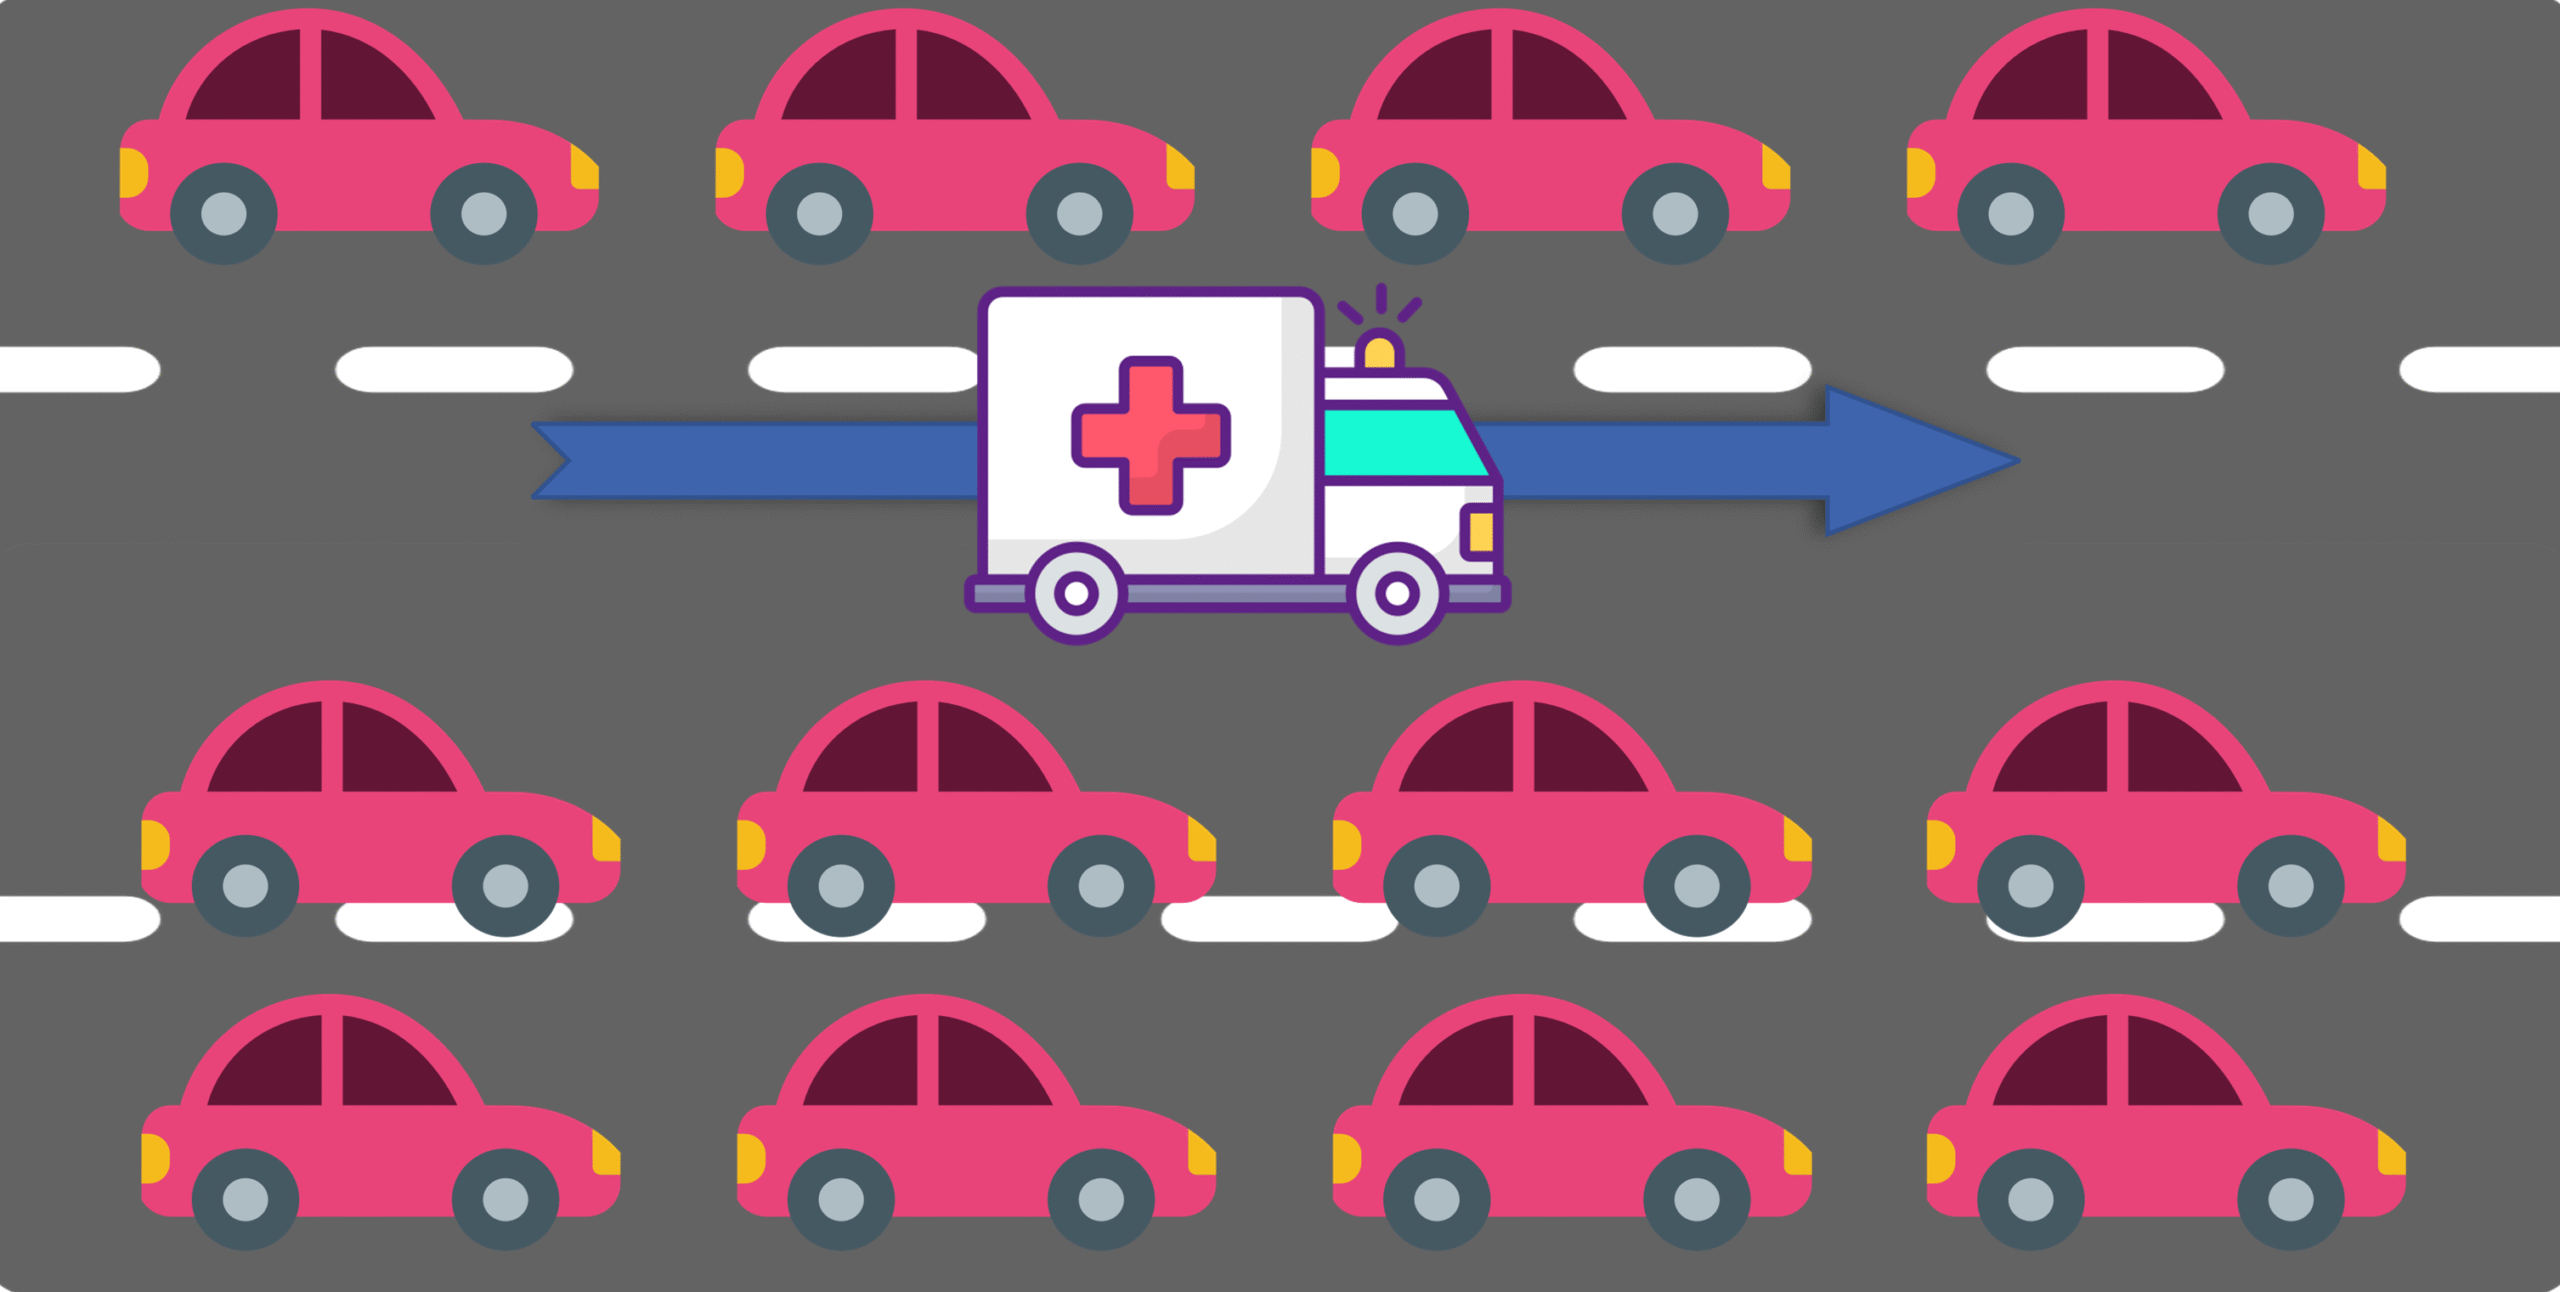
To understand Quality of Service (QoS), imagine you’re driving on a busy highway. The road is full of cars, and everything is moving very slowly.

Now, picture an ambulance appearing. Even though traffic is heavy, all the cars move aside to let the ambulance pass because its journey is urgent and must be prioritized.

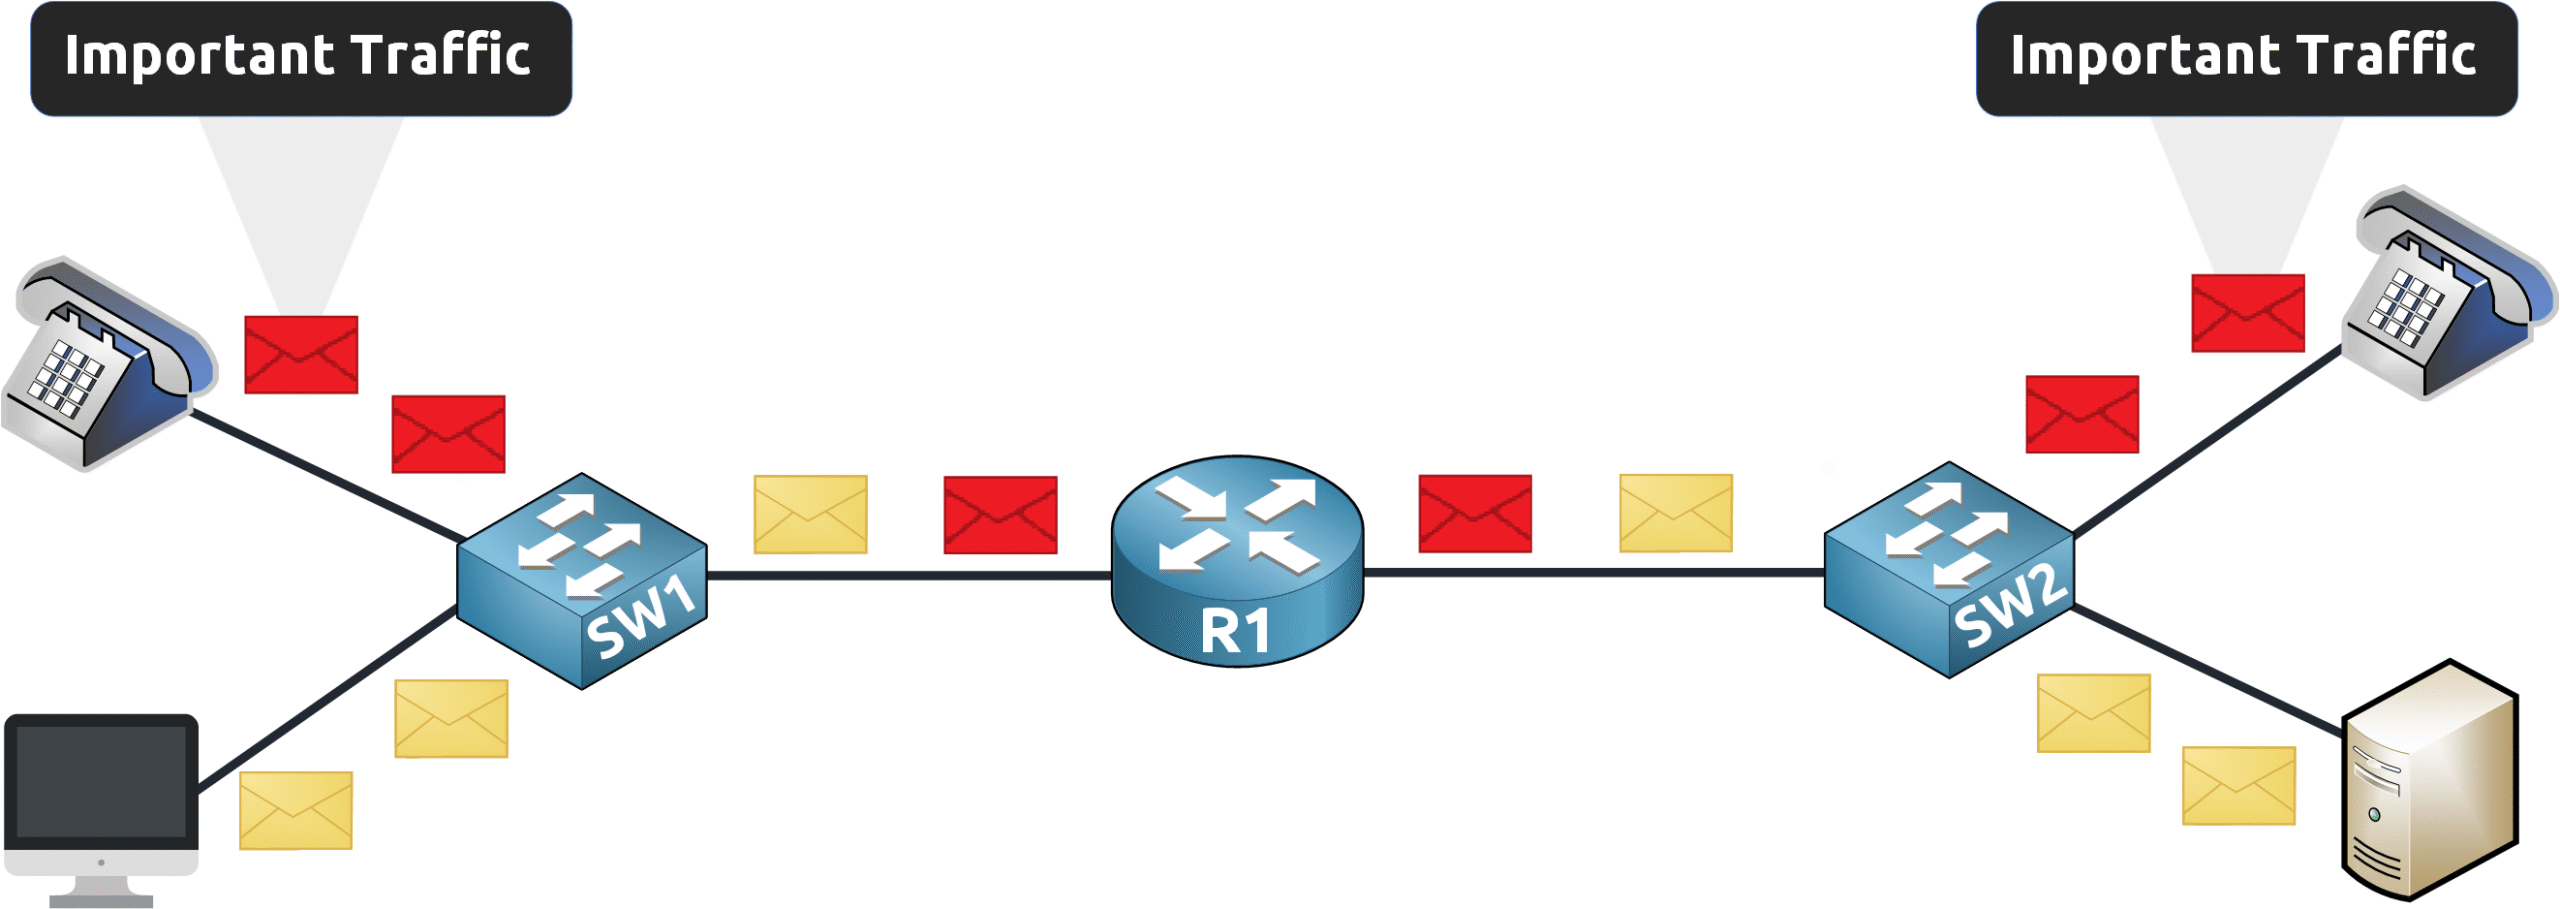
In a network, the situation is similar. Different types of traffic—such as emails, voice calls, and video streams—are sent at the same time.

Without QoS, every data packet is treated equally, much like cars obeying a strict “first in, first out” rule. This means even critical information can end up waiting its turn.

However, with QoS, you can prioritize important traffic. Just as the ambulance gets the right of way, QoS ensures that high-priority data (like voice packets from an IP phone) is delivered first, keeping calls clear and smooth.
2. Network Congestion
Before we explore QoS further, let’s look at the challenge it addresses: Network Congestion.
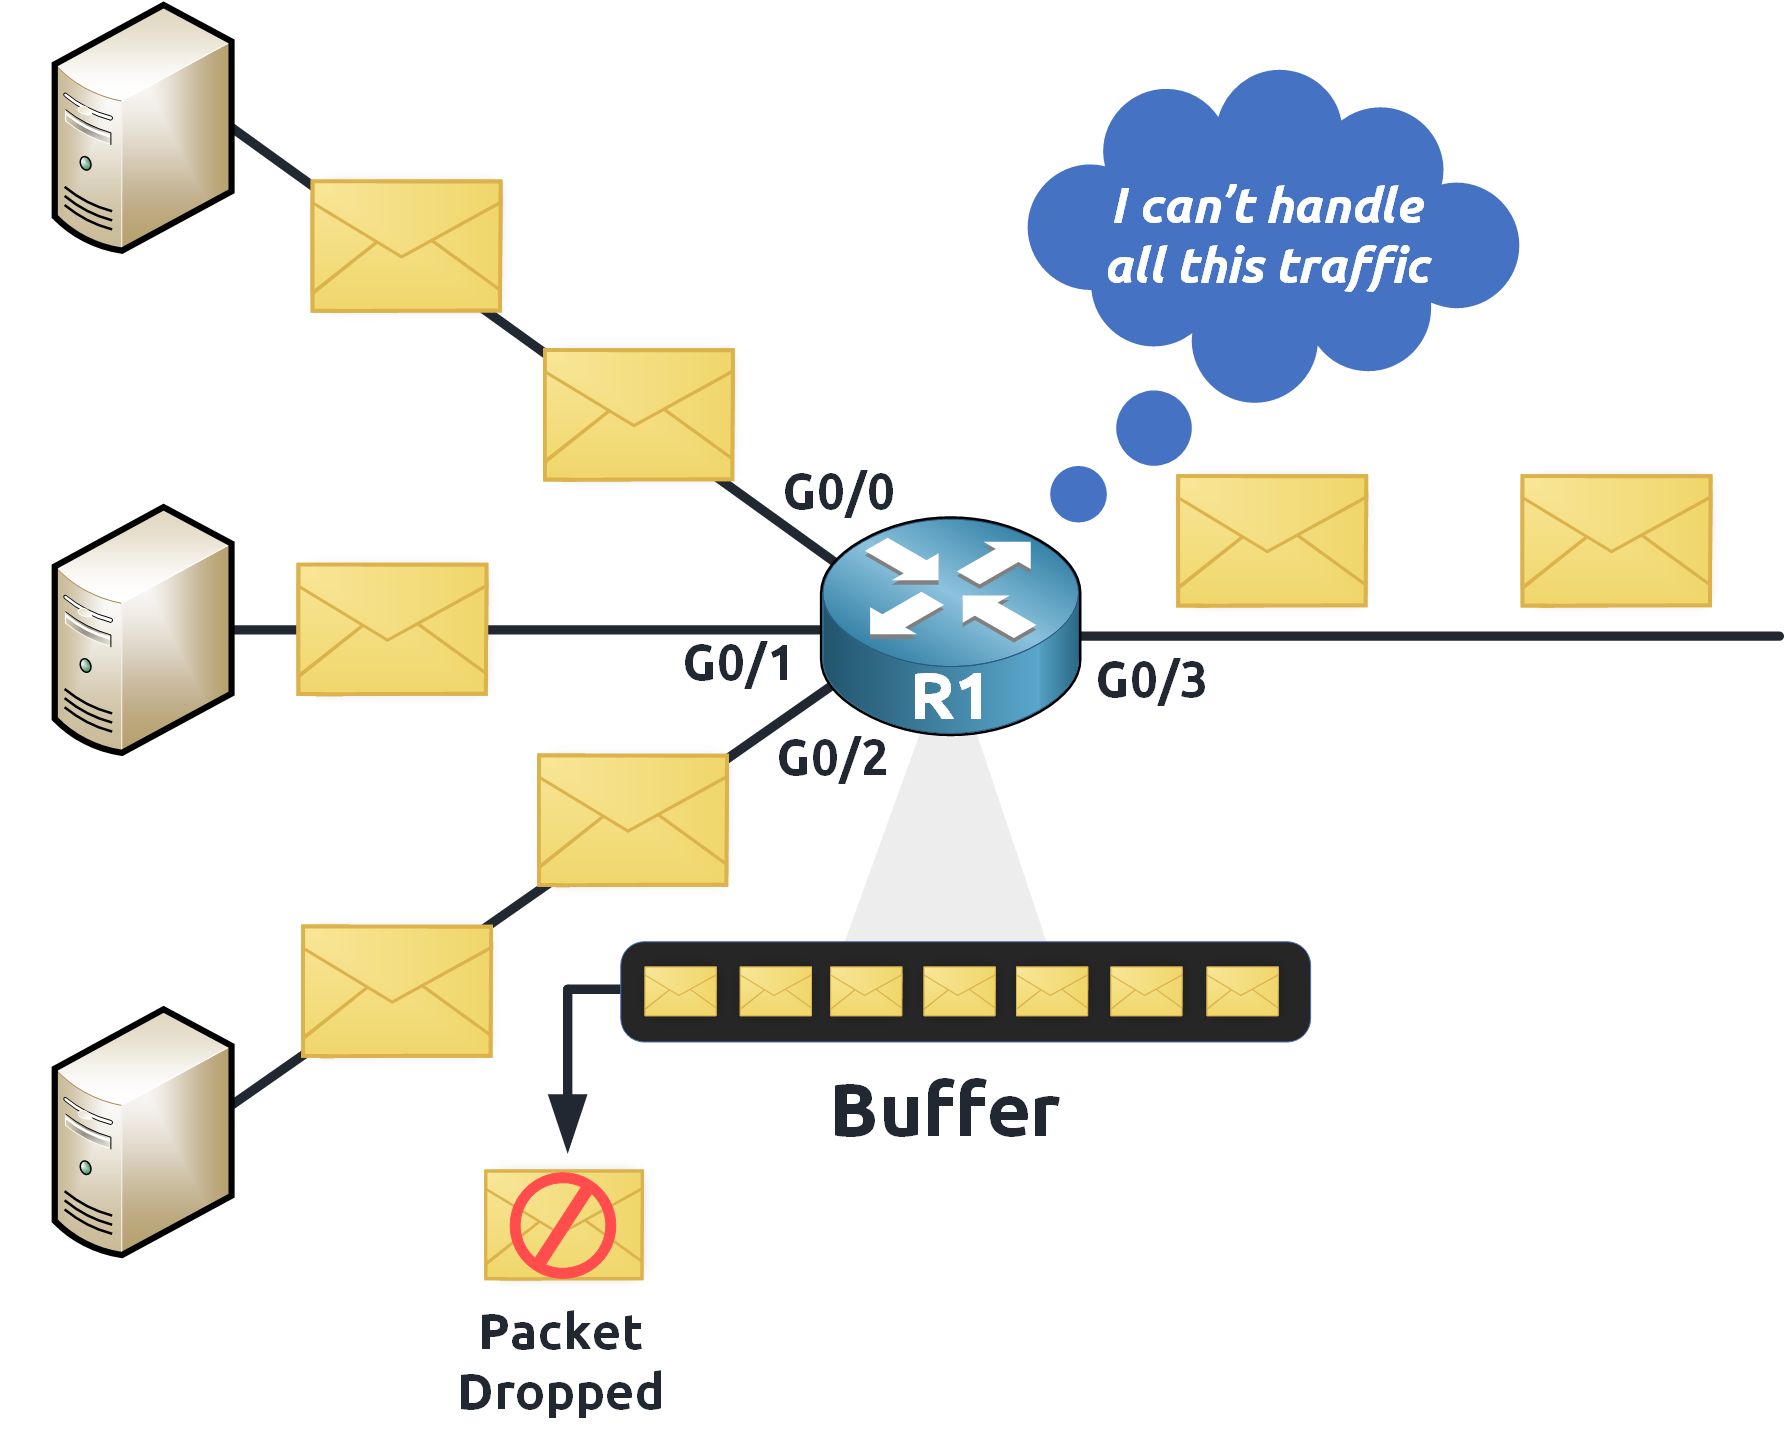
Network congestion occurs when a network device receives more traffic than it can send out because the outgoing interface’s capacity is exceeded.
Imagine three Gigabit interfaces, each running at 1 Gbps, all sending data towards a destination via interface g0/3. Since g0/3 can handle only 1 Gbps, it becomes overwhelmed.

In this situation, the router (R1) will temporarily store the extra packets in a buffer (a kind of temporary memory) until it can process them. But if the congestion continues and the buffer fills up, new packets may be dropped, leading to packet loss.
Understanding congestion is essential because it highlights the need for QoS: to make sure that even when the network is busy, important data gets through without unnecessary delay.
3. QoS Metric
Now, let’s look at some key metrics used to evaluate Quality of Service in a network.
Bandwidth
Bandwidth is the maximum amount of data a network interface can transmit in a given time period, typically measured in bits per second (bps). For example, a Gigabit Ethernet interface operates at 1000 Mbps, meaning it can theoretically handle 1,000,000,000 bits per second.

💡 Think of bandwidth as the width of a highway, the wider it is, the more traffic (or data) it can accommodate.
Delay
Also known as latency, delay is the time it takes for a packet to travel from its source to its destination. High delay can disrupt real-time applications like VoIP or video conferencing.

In our example, a packet takes 16 ms (milliseconds) to reach its destination !
Jitter
Jitter refers to the variation in delay between packets arriving at their destination. Ideally, packets should arrive at consistent intervals for smooth data flow. When there’s too much variation, packets may arrive out of order, affecting real-time services like streaming video or voice.
The diagram below shows an ideal scenario with packets arriving at regular intervals.

In real-world networks, various factors can cause delays to vary, as shown in the diagram below.

Packet Loss
Packet loss occurs when packets are dropped during transmission and never reach their destination. This usually happens during network congestion when a device’s buffer is full.
For instance, if a client sends three packets to a server and one packet is lost, the service quality is affected.

Packet loss can result from hardware issues or simply because too much data is sent through a device at once.
Next Steps: Exploring Traffic Types
In the next lesson, we will explore various traffic types including Voice, Video and Data. Understanding these traffic categories is crucial for applying QoS effectively, as it helps you decide which data needs the highest priority when congestion occurs.
